Bitcoin has lost nearly half of its value since peaking above $125,000 last October. Now multiple catalysts are converging at the same time to drive the next big move.
That includes legislation making its way through Congress. The Clarity Act would help establish a regulatory framework for digital assets (including crypto) and is waiting for a vote in the Senate.
At the same time, investors will parse every word said and written following the Federal Reserve’s latest meeting this week.
New Fed Chair Kevin Warsh has already surprised investors with hawkish talk on inflation. The forward path of monetary policy will play a big part in driving market liquidity… and Bitcoin.
For crypto traders wondering how it will all play out, zooming out and tracking key chart levels can help tip the next move. Here’s what I’m watching…
Following Bitcoin’s peak last October, the largest crypto by market value has settled into a recurring bearish chart pattern.
Bitcoin has repeatedly formed and broken down from something called a bearish flag pattern.
Here’s the chart below:
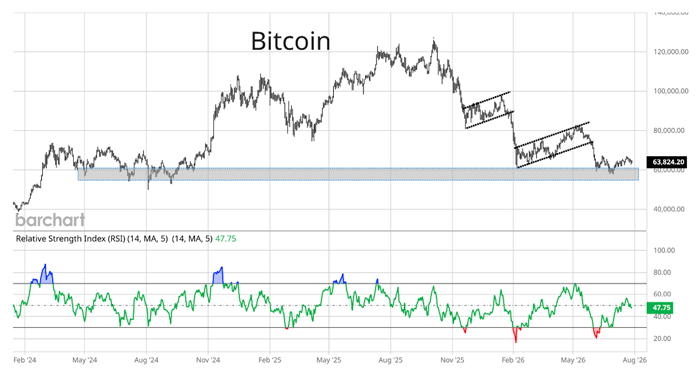
The dashed trendlines show the last two bear flag patterns. It’s when Bitcoin has traded inside a channel against the prevailing trend, which has ultimately led to new lows. It’s a bearish flag in this case because the pattern is upward sloping and formed within an overall downtrend.
That’s keeping the trend of lower highs and lower lows intact – the definition of a primary downtrend.
The most recent break brought Bitcoin right back to a key support level. The area around $60,000 (shaded zone) has been tested multiple times this year. It’s also a key congestion zone tested numerous times in 2024.
That makes the $60,000 area an important “make-or-break” level that you need to watch closely.
Here are the signs that would point to a major breakdown… and what could spark a rebound instead.
Bitcoin has seen a rally off the most recent test of $60,000, which was tipped by a positive momentum divergence.
Here’s the zoomed-in chart below.
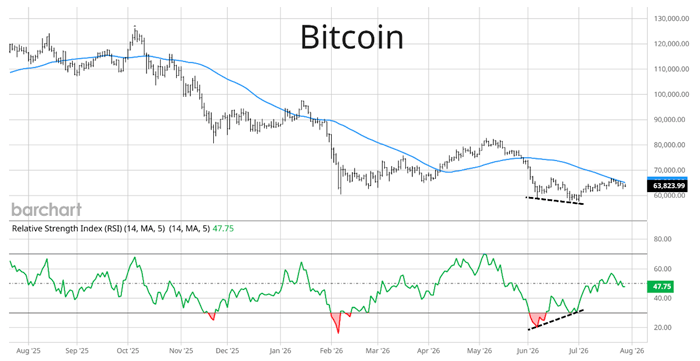
The Relative Strength Index (RSI) tracks underlying price momentum. It made a higher low as Bitcoin briefly made a new low under $60,000 (dashed lines).
That bullish divergence at a key support level tipped a rebound. But now we have another bearish flag pattern emerging. Take another look at the chart.
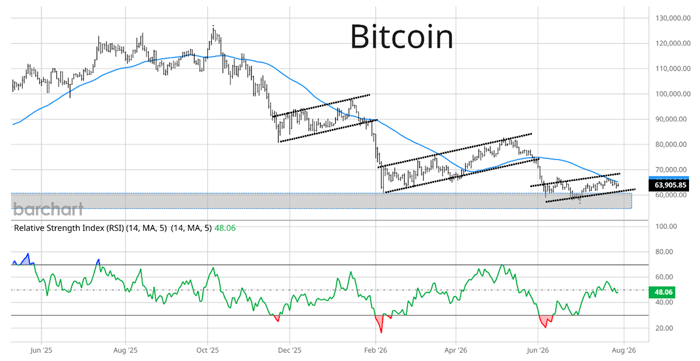
The third set of dashed lines shows the latest flag pattern forming. At the same time, Bitcoin is testing resistance at the 50-day moving average (MA – blue line).
With all the catalysts in play, including the Fed and crypto legislation, we need to stay open to possible trade scenarios.
The first scenario is another breakdown out of the current bear flag pattern. That could put the $60,000 level back in play, where a sustained breach of support could lead to another sharp move lower.
But a false breakdown alongside another momentum divergence (like the RSI example noted above) could deliver a powerful reversal higher.
Those are the scenarios that you need to watch for the next big move in Bitcoin – and how you can use technical analysis to stay objective amid all the noise.
Happy Trading,
Larry Benedict
Editor, Trading With Larry Benedict
Reading Trading With Larry Benedict will allow you to take a look into the mind of one of the market’s greatest traders. You’ll be able to recognize and take advantage of trends in the market in no time.