Larry’s Note: Ready or not, the next “24-hour profit window” is opening soon.
And folks who follow my trade alerts will have the chance to place a simple trade in the morning and potentially collect hundreds or thousands by 4 p.m. ET.
If you want a very real chance to break free financially in 2025… please join me tonight at 8 p.m. ET for a full breakdown of this strategy.
There are only a few hours left to RSVP for free with a single click.
A chorus of bullish headlines is captivating investors.
Every day seems to bring another multibillion-dollar artificial intelligence (AI) deal. Just this week, Amazon (AMZN) and OpenAI announced a $38 billion partnership.
The Federal Reserve’s easing cycle also looks well underway after the central bank cut interest rates at its last two meetings. Investors are anticipating more cuts over the coming year.
And President Trump announced a long-awaited trade deal with China that seeks to ease trade tensions for now. That helps remove a major fear hanging over the market ever since the trade war sent stock prices plunging in early April.
Investors have responded by pushing stock prices to new heights, as you might expect… except one key confirming indicator is missing.
If the prevailing mood is supposed to be bullish, then cryptocurrencies are sending a warning…
If there’s one corner of the market where investor euphoria and fear are on full display, it’s cryptocurrencies.
The emotional tug of fear and greed gets amplified across cryptocurrencies like Bitcoin.
When Bitcoin starts to diverge from the stock market’s trend, that’s a warning to be on the lookout for a change in stocks’ direction.
We’ve already seen several examples this year.
Heading into the stock market’s meltdown earlier this year, the price of Bitcoin topped out just under $107,000 on January 21. That was a month before the S&P 500 peaked on February 19.
Bitcoin also hinted at the rally off the April lows. While the S&P 500 was plunging in early April, Bitcoin only slightly undercut its prior low and showed relative strength.
Given Bitcoin’s tendency to lead changes in trend, it’s concerning that Bitcoin hasn’t been confirming the S&P 500’s new highs since the summer months.
It’s actually quite the opposite. Bitcoin is now losing key price support levels. Let’s look at those levels and why this action spells trouble for the stock market…
Bitcoin is warning that we could be about to see a change in direction for risk assets like stocks.
Recently, we’ve been tracking a bearish divergence between Bitcoin and the stock market. While the S&P 500 has been steadily marching to new highs since June, Bitcoin peaked in July and settled into a trading range. Here’s the chart below.
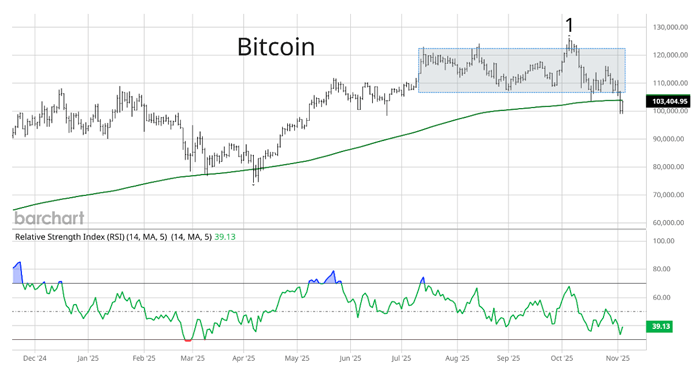
The shaded box shows Bitcoin’s trading range, including a false breakout at point 1. The failed breakout was another momentum warning from Bitcoin.
Not only did Bitcoin not confirm the new highs in the S&P 500, but its price is now starting to break down below key support levels. Take another look at the chart.
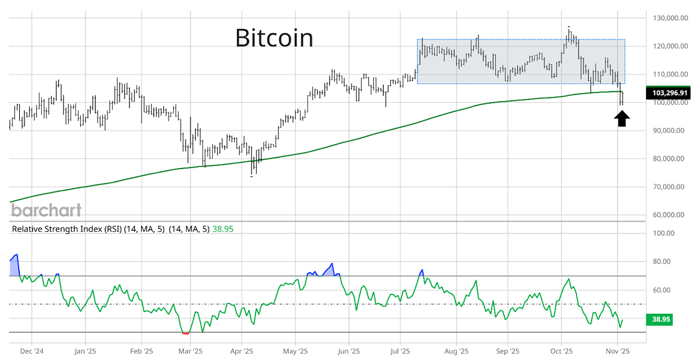
Bitcoin is dropping below its recent trading range… and is also taking out the 200-day moving average (MA – green line) for the first time since the sell-off into April.
Bitcoin is now testing the 200-day MA from below as resistance.
If Bitcoin gets rejected off the 200-day MA, the next support to watch is the psychologically important $100,000 level.
A sustained break below $100,000 would point to downside momentum picking up for Bitcoin. That would be a negative sign for just about any “risk-on” asset, including stock prices…
Happy Trading,
Larry Benedict
Editor, Trading With Larry Benedict
Reading Trading With Larry Benedict will allow you to take a look into the mind of one of the market’s greatest traders. You’ll be able to recognize and take advantage of trends in the market in no time.
