|
Larry’s note: Welcome to Trading with Larry Benedict, the brand new free daily eletter, designed and written to help you make sense of today’s markets. I’m glad you can join us. My name is Larry Benedict. I’ve been trading the markets for over 30 years. I got my start in 1984, working in the Chicago Board Options Exchange. From there, I moved on to manage my own $800 million hedge fund, where I had 20 profitable years in a row. But these days, rather than just trading for billionaires, I spend a large part of my time helping regular investors make money from the markets. My goal with these essays is to give you insight on the most interesting areas of the market for traders right now. Let’s get right into it… |
Yesterday, we broke down the first half of the latest 100% winner in my trading service – The Opportunistic Trader.
I used one of my favorite strategies, mean reversion, to spot a good time to buy puts on Goldman Sachs (GS).
In just one week, we were able to make over 100% – and double our money.
So, today I’m going to show you how (and why) we exited the trade for a win.
First, let’s take another look at the chart from yesterday…
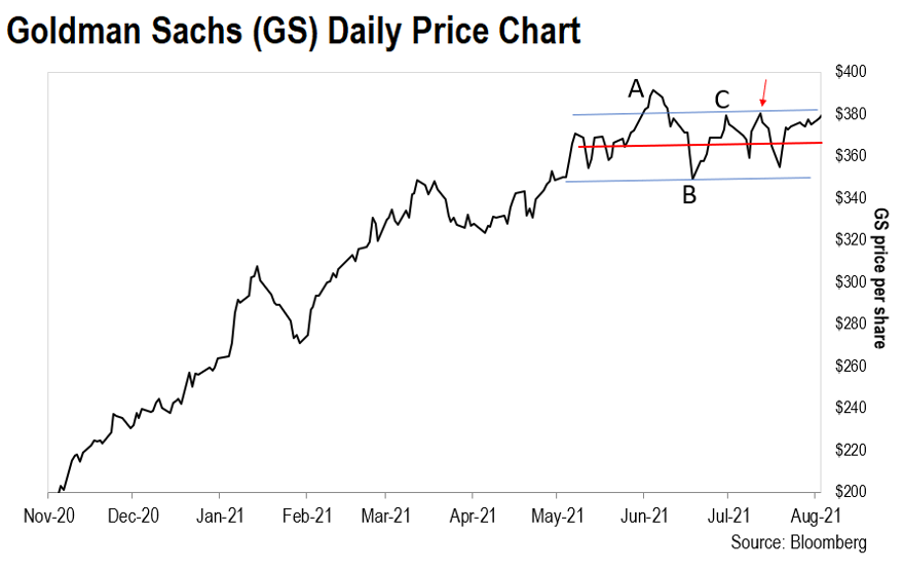
To recap, we knew a potential change in trend was in place, when GS failed to make a higher high. In other words, the ‘C’ high on the chart was lower than the ‘A’ high.
When GS failed to break above the blue line a second time (around the red arrow), I knew it was time to go short.
So, we bought a put option on July 13 (red arrow) – a trade where we should benefit if the share price fell.
To find out what happened next – and why we exited the trade – let’s take an even closer look at the price action.
To do that, let’s use a bar chart so we can see each daily move more clearly…
The vertical black line represents the high and low the stock traded at for the day.
The left and right horizontal lines represent the opening and closing price of the stock, respectively.

Source: eSignal
Again, the red arrow shows where we entered the trade on July 13.
From there, GS traded lower, closing just above $364 on Friday, July 16. That’s exactly what we wanted to see.
However, it’s the price action on Monday (July 19) that determined what we did next.
As you can see, on Monday GS opened much lower (green arrow) – right on $354.
From there, it traded down to $349, before reversing and closing all the way back up at $355. That was above the opening price.
This kind of price action – a reversal – should really get your attention as a trader.
To me, this meant something quite clear… This short down-trend – a trend that started on July 13 – was most likely over.
Put simply, buyers were again in control of the market – causing the stock to begin its move higher.
From there, our exit plan was clear…
So, first thing Tuesday morning (July 20), we exited the trade for about a 110% profit.
That’s one heck of a return for a trade that lasted just a single week. Take out the weekend, and that equates to just five trading days to double your money!
That’s why mean reversion is so effective. When a stock fails to break its trend, you can often bet against it. So in this case, we bought put options – which allow you to make money as the price of the stock falls.
We figured GS would move lower because it had failed to make a higher high, so we bet against it.
And because we used options, we were able to make a bigger gain than if we used a stock trade to bet against it. That’s why we were able to make 100%.
When you’re trading over such short timeframes – as with mean reversion – it’s important to have both your entry and exit strategies nailed down.
Without both, you can see how our GS trade would have unravelled. Had we stayed in the trade a little longer, our profit would’ve been wiped out as the stock moved higher.
Too often when folks get started in trading, they only think about the entry part of the trade.
They’re just so keen to get a piece of the action.
But hopefully, now you can see why it’s just as important – if not more – to know when to get out too.
Learning to do so will help make you a better trader. And, you’ll continue to “put a profit on the page.”
Tomorrow, I’ll be back with another lesson.
Stay tuned…
Larry Benedict
Editor, Trading With Larry Benedict
P.S. We’re excited to hear what you think of your new eletter, Trading With Larry Benedict. Let us know at feedback@opportunistictrader.com.
Reading Trading With Larry Benedict will allow you to take a look into the mind of one of the market’s greatest traders. You’ll be able to recognize and take advantage of trends in the market in no time.
