|
Larry’s note: Welcome to Trading with Larry Benedict, the brand new free daily eletter, designed and written to help you make sense of today’s markets. I’m glad you can join us. My name is Larry Benedict. I’ve been trading the markets for over 30 years. I got my start in 1984, working in the Chicago Board Options Exchange. From there, I moved on to manage my own $800 million hedge fund, where I had 20 profitable years in a row. But these days, rather than just trading for billionaires, I spend a large part of my time helping regular investors make money from the markets. My goal with these essays is to give you insight on the most interesting areas of the market for traders right now. Let’s get right into it… |
This week, we’ve been focusing on mean reversion, a vital part of my trading success.
The strategy works in any kind of market… even one that’s not trending at all.
We’ve already applied mean reversion to trading gold and silver.
Today I want to take it a step further, and break down a recent winning trade of mine…
I’m going to show you how we used mean reversion to profit in my trading service – The Opportunistic Trader. We were able to make over 100% in one week on our Goldman Sachs (GS) put options.
We’re going to break this trade down in two parts. Today, we’ll focus on our entry. Then, tomorrow we’ll focus on our profitable exit.
Let’s start with a daily price chart of Goldman Sachs…
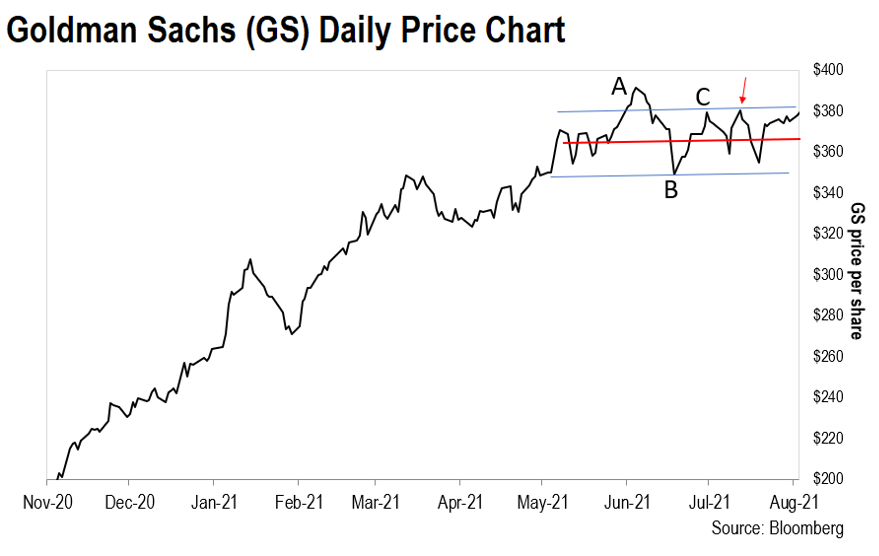
As the chart shows, GS rallied strongly from last November up until this June.
During this time, the share price doubled.
But after hitting a high of just over $393 on June 7 (‘A’ on the chart), the share price fizzled.
10 days later, GS was trading more than 10% lower, at around $348 (‘B’).
After trying to rally again, the stock lost momentum. This time, it peaked around $381 a share (‘C’) on July 1.
This type of price action really caught my attention.
I knew straight away that a trade could be in the cards.
But why?
When a stock rallies strongly, you can expect to see some pullbacks.
After all, stocks don’t move higher in a straight line.
As the chart shows, GS had several pullbacks in its rally from November to June.
However, the stock continued to make higher highs. Right up until June, that is.
If a stock fails to trade higher than its previous high after a pullback, it can mean the uptrend is over. And that’s exactly what happened to GS coming into July.
GS failed to make a higher high, peaking at a lower price instead.
Put simply, the ‘C’ high was lower than the ‘A’ high.
Let’s take another look at the chart using the format we’ve applied in previous essays this week…
To recap, the red line is the trend line. And 95% of the price action takes place in between the blue lines.
When GS tried a second time to break through the upper blue line and failed, I knew it was time to go short. So, we entered this trade on July 13 (the red arrow).
For this trade, I bought a put option – something that should benefit if the stock price falls. When a trader goes short, they typically buy put options.
That’s because I expected GS to move lower. And as you can see, it sharply fell just a few days after I bought the puts.
To find out how we exited the trade for a 100% gain, tune in to tomorrow’s essay…
Regards,
Larry Benedict
Editor, Trading With Larry Benedict
P.S. We’re excited to hear what you think of your new eletter, Trading With Larry Benedict. Let us know at feedback@opportunistictrader.com.
Reading Trading With Larry Benedict will allow you to take a look into the mind of one of the market’s greatest traders. You’ll be able to recognize and take advantage of trends in the market in no time.
