Larry’s Note: Last week, I sat down with Jeff Brown for an emergency briefing…
We believe the U.S. dollar is set to break on October 7. Not weaken, not slip, break… in just two days.
This could effectively cost the biggest winners of the AI boom as much as 40% of their gains. Right now, your cash, bonds, and the dollars in your pocket are closest to the danger.
Jeff and I detailed exactly what’s going on with the dollar – as well as a three-step strategy for going after profits in the aftermath – during last week’s briefing.
There isn’t much time left to prepare… that’s why we’ve made a replay available a short while longer. You can watch that right here.
A much cooler-than-expected consumer inflation report should’ve provided some relief… but bonds can’t seem to catch a break.
The Personal Consumption Expenditures (PCE) price index is closely watched since it’s the Federal Reserve’s preferred inflation gauge. PCE inflation for the month of August came in at 3.4% versus expectations for 3.7%.
That should’ve come as a relief to investors looking for any signs of slowing inflation. But bonds continued their selloff anyway.
Following the report, the 10-year Treasury yield jumped as high as 5.29% – the highest level since 2002. The 30-year Treasury rate topped 5.64%, which is a level not seen since 2001.
But just when it looks like yields can do nothing but soar, signs are growing that the move is overdone.

Jeff Brown calls it the “AI Master Key” – a tiny chip loaded on top of Nvidia’s processors. It’s sold out through 2027. The AI giants are expected to spend $2 trillion a year on the AI Master Key. And the three American-controlled companies are set to take off on Dec. 30. Jeff shows you how to get in with as little as $500 – and names one stock free.Click here to see how.
It’s not stocks, or options. Or futures. Or crypto… Jeff Brown calls it “practically crash- proof”.. He also named the date he believes money starts moving into it: Wednesday, October 7. The facts are online for a limited time only. Click here to learn more.
High energy prices, rising inflation, large government budget deficits, rising corporate debt issuance…
The catalysts driving higher interest rates keep stacking up.
That’s pushing longer-dated bond yields out of a chart pattern that warned of higher interest rates.
Look at this chart of the 30-year Treasury yield…
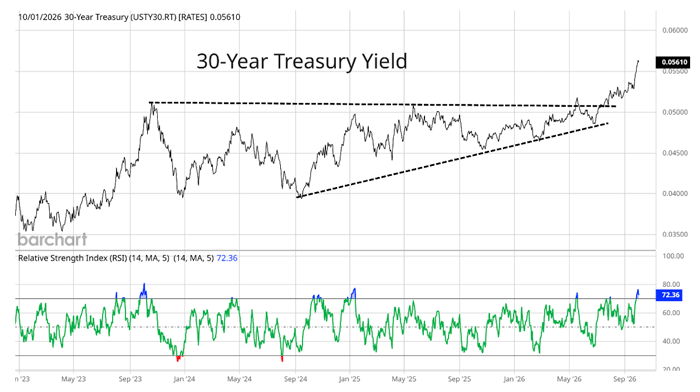
The 30-year formed an ascending triangle pattern over a period stretching back to 2023. The pattern is characterized by a resistance level that keeps being tested while higher lows are formed along the way.
Ascending triangles usually break out to the upside, which is exactly what happened when the 30-year yield pushed above 5%.
That break out has sparked a big move in rates, with the 30-year yield rising as high as 5.64%.
Remember that bond prices move opposite to yields, so bond prices are selling off as rates move higher.
But the move in one ETF tracking longer-dated bond prices looks like it’s overdone, which could set up a mean-reversion trading opportunity.
As the 30-year Treasury yield started moving out from the ascending triangle pattern, an ETF tracking bond prices broke down from a key level.
Take a look at the chart below of the iShares 20+ Year Treasury Bond ETF (TLT) that tracks long-term bond prices.
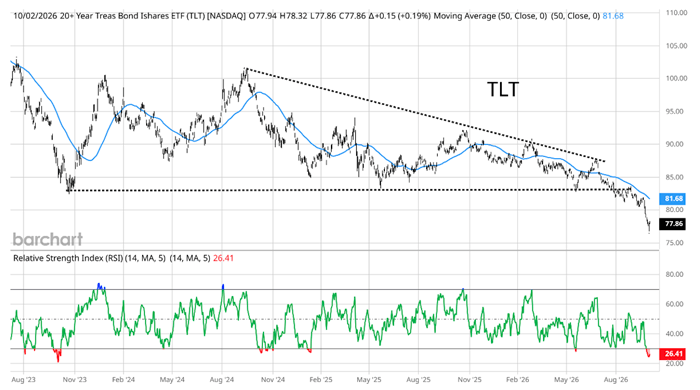
As the 30-year yield kept testing resistance near the 5% level noted above, TLT was testing support at the $83 level (lower dashed line).
Following the breakout in yields, TLT fell below that support level. But now TLT is showing signs of being extremely extended to the downside, which could set up a reversal higher.
Take one more look at the TLT chart at more recent price action.
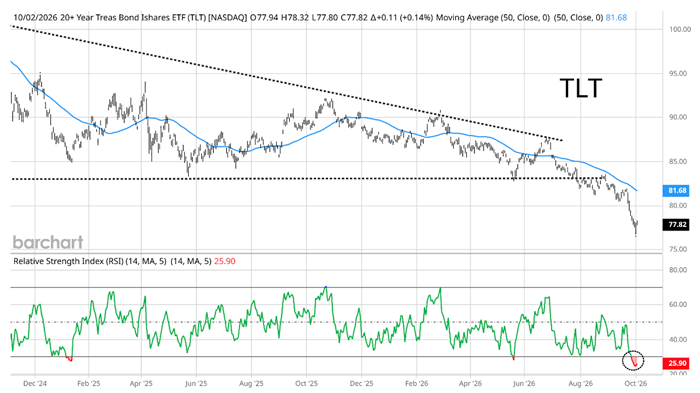
The jump in bond yields and selloff in prices is pushing TLT to deeply oversold levels. Price is extended 5% below the 50-day moving average (MA – blue line). The Relative Strength Index (RSI) also fell to 24 – the most oversold level in three years.
The reasons driving a quick rise in interest rates aren’t going away any time soon. But bond yields won’t keep rising in a straight line forever.
For now, the jump in yields and corresponding selloff in bond prices looks ready to reverse.
Regards,
Larry Benedict
Editor, Trading With Larry Benedict
Reading Trading With Larry Benedict will allow you to take a look into the mind of one of the market’s greatest traders. You’ll be able to recognize and take advantage of trends in the market in no time.