|
Larry’s note: Welcome to Trading with Larry Benedict, the brand new free daily eletter, designed and written to help you make sense of today’s markets. I’m glad you can join us. My name is Larry Benedict. I’ve been trading the markets for over 30 years. I got my start in 1984, working in the Chicago Board Options Exchange. From there, I moved on to manage my own $800 million hedge fund, where I had 20 profitable years in a row. And, I’ve been featured in the book Market Wizards, alongside investors like Paul Tudor Jones. But these days, rather than just trading for billionaires, I spend a large part of my time helping regular investors make money from the markets. My goal with these essays is to give you insight on the most interesting areas of the market for traders right now. Let’s get right into it… |
Given the huge coverage enjoyed by the mega-tech stocks – in particular Facebook, Amazon, Apple, Netflix, and Google (FAANG) members – it’s no wonder that many investors often pass on “boring” industrial stocks.
After all, these tech giants delivered in spades for investors that got in early and are now enjoying triple-digit returns.
Momentum in these stocks (particularly since May 2021) helped drive the broader market higher. As we came into the new year, however, tech stocks were already starting to come under pressure…
(Yesterday we looked at Netflix, which is already down 25% from its November high.)
Today we’ll take a look at how weakness in industrials could cause a wider breakdown in the S&P 500…
Rising interest rates and potentially lower growth are causing investors to question the already sky-high multiples of FAANG stocks. Even after falling 15% since November, Amazon is still trading on a price-to-earnings (P/E) ratio above 60.
That means if the wider market is going to withstand any selloff, industrial stocks are going to have to carry a far bigger share of the load.
As you can see in the chart below, after rising in the first part of 2021, the Industrial Select Sector SPDR ETF (XLI) has been stuck in a sideways pattern since May 2021…
Industrial Select Sector SPDR ETF (XLI)
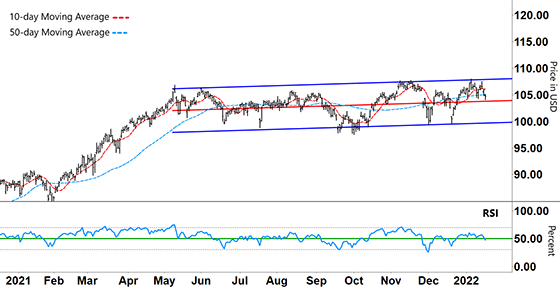
Source: eSignal
The red line in the middle shows the overall trend. The chart shows just how closely this is tracked by the 50-day moving average (MA – blue dashed line).
The two blue lines define the upper (resistance) and lower (support) bounds of the trading channel, and much of the trading action happens inside these lines.
When XLI’s share price has hit either support or resistance, it has regularly bounced back in the opposite direction.
On January 5, XLI rebounded lower off resistance and is now trading right around the middle point of the range (middle red line). As you can see in the lower half of the chart, the Relative Strength Index (RSI) is also right in the middle of its range…
The RSI is touching its support level at 50% (green line).
So, what can we expect from here?
Let’s take another look at the chart…
Industrial Select Sector SPDR ETF (XLI)
Source: eSignal
Well, when the RSI previously broke down below support (throughout this sideways pattern), XLI’s share price also fell. This happened in June, July, September, and December 2021.
If the RSI breaks down below support with its current move, then that could provide an opportunity to go short. Our initial price target would be right around support near $100.
However, if the RSI holds support and forms a ‘V’, XLI could very quickly rebound back (providing a brief long trade) to the upper perimeter of its trading range. Right now, the RSI holds the key to any trades in the immediate future.
If we look further into the future, the action in XLI has wider considerations…
The longer support or resistance holds, the stronger those levels become. After being in a sideways pattern for nine months, it becomes a much bigger deal if XLI were to break through either bands of the trading channel.
And, that could be the precursor to a much bigger move.
However, beyond that is the wider scope of how tech stocks track in relation to XLI.
If tech stocks continue to fall and XLI breaks below support, then that means the broader market (S&P 500) could be vulnerable to much bigger falls.
Regards,
Larry Benedict
Editor, Trading With Larry Benedict
What are your predictions for FAANG stocks?
P.S. We’re excited to hear what you think of your new eletter, Trading With Larry Benedict. Let us know at feedback@opportunistictrader.com.
Reading Trading With Larry Benedict will allow you to take a look into the mind of one of the market’s greatest traders. You’ll be able to recognize and take advantage of trends in the market in no time.
