|
Larry’s note: Welcome to Trading with Larry Benedict, my free daily eletter, designed and written to help you make sense of today’s markets. I’m glad you can join us. My name is Larry Benedict. I’ve been trading the markets for over 30 years. I got my start in 1984, working in the Chicago Board Options Exchange. From there, I moved on to manage my own $800 million hedge fund, where I had 20 profitable years in a row. And, I’m featured in the book Market Wizards, alongside investors like Paul Tudor Jones. But these days, rather than just trading for billionaires, I spend a large part of my time helping regular investors make money from the markets. My goal with these essays is to give you insight on the most interesting areas of the market for traders right now. Let’s get right into it… |
We’re less than a week away from the Federal Reserve’s next meeting…
Where their only focus should be tackling runaway inflation – which currently sits at 7.5%.
Prices across almost every industry have soared. Oil, rent, food, and gas prices are out of control.
Yet one sector has lagged behind… but that could soon change.
Today, I want to share an opportunity in the materials sector. These are products like chemicals, gases, and paints.
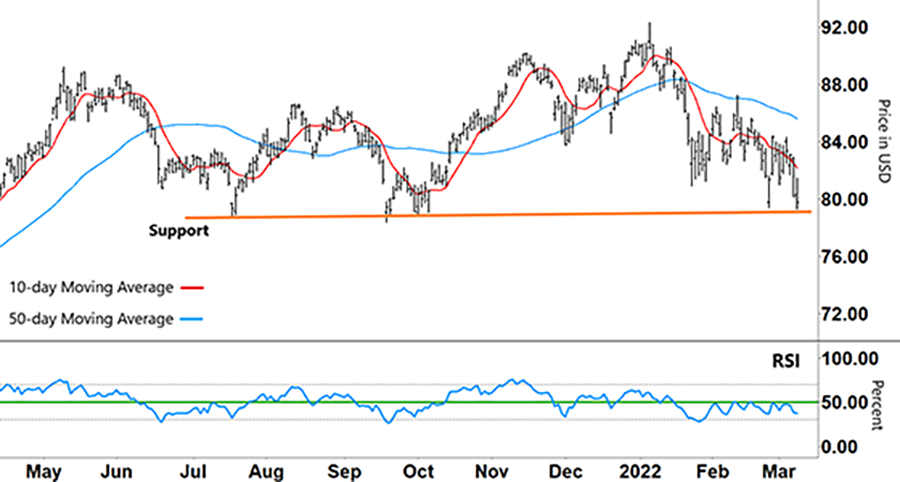
In the chart below, you can see how the Materials Select Sector SPDR Fund ETF (XLB) sold off like the rest of the market since the start of the year…
Materials Select Sector SPDR Fund ETF (XLB)
Source: eSignal
You can also measure the steepness of that fall by our two moving averages.
The 10-day moving average (MA – red line) crossed down sharply over the long-term 50-day MA (blue line).
XLB is re-testing long-term support after falling 13%. As the chart shows, that support (orange line) has held since July 2021.
A bounce off this level could be the catalyst for a strong move higher.
When XLB first found support back in July 2021, the Relative Strength Index (RSI) triggered XLB’s subsequent rally.
With the RSI forming a ‘V’ from oversold territory (lower grey horizontal line in the lower half of the chart), it then broke up through resistance (green line) with buying momentum pushing XLB higher.
A reversal in momentum in mid-August then caused XLB to peak before falling lower.
It’s a pattern that repeated in September when XLB tested support. With the RSI moving from oversold to overbought (above the upper grey line), XLB rallied to a fresh high before rolling over again as momentum reversed.
With XLB testing support most recently in February and March, a repeat of these two previous patterns would be the catalyst for XLB to rally strongly.
So, what am I looking for next?
Let’s take another look at the chart…
Materials Select Sector SPDR Fund ETF (XLB)
Source: eSignal
Since going into oversold territory in late January, the RSI has remained in the bottom half of its range (below the green line). For XLB to rally off support, the RSI will need to break back through its resistance and into the upper half of its band.
The other thing I’ll be watching are the two MAs.
Since May 2021, XLB has been in a broadly sideways pattern. The 50-day MA is currently at a similar level to where it was back in June 2021.
If the 10-day MA can cross back above the 50-day MA with the RSI breaking through resistance, then that setup could provide an opportunity for a long trade.
After that, the next test for XLB would be to take out its January 5 high ($92.31).
Right now, the markets look scary, and investors simply want to sit on the sidelines until the volatility passes.
However, the chart shows that there are still plenty of potential trading opportunities to find.
Regards,
Larry Benedict
Editor, Trading With Larry Benedict
Reader Mailbag
In today’s mailbag, a subscriber thanks Larry for his recent essay…
Thank you, Larry, for the information on Russia and the stock market.
– Barbara
P.S. We’re excited to hear what you think of your new eletter, Trading With Larry Benedict. Let us know at [email protected].