Note: In just a few hours, at 2 p.m. ET, Jeff Brown and Porter Stansberry are going live to reveal:
The real reason behind Trump’s tariffs – and the unstoppable force quietly reshaping America’s entire economy
How a single executive order is funneling trillions of dollars into three new pillars of the U.S. financial system – and which five stocks could soar as a result
The historical pattern behind this shift – one that’s triggered wealth surges of 280%, 482%, and even 1,272% in past cycles
If you don’t want to miss out, then RSVP now to automatically claim your seat for this eye-opening event.
Folks who don’t follow the markets closely could be forgiven for thinking it’s been an uneventful year so far…
As we approach 2025’s halfway point, the S&P 500 is up around 2.4% year-to-date (YTD). The Nasdaq is faring slightly better at 3.8%.
What’s more, volatility as measured by the CBOE Volatility Index (VIX) is flat on the year. It’s now around 17, where it finished in 2024.
Yet it’s been anything but smooth sailing. Not only did stocks crash from their February highs… but we’ve also witnessed one of the most remarkable recoveries I’ve seen in my over 40-year career.
Of course, most folks focused on the Magnificent Seven in all this turbulence. But one stock that’s gotten less attention has merrily continued a rally that began back in May 2022.
Now streaming juggernaut Netflix (NFLX) is in danger of overheating. So let’s check out what to watch on the chart…
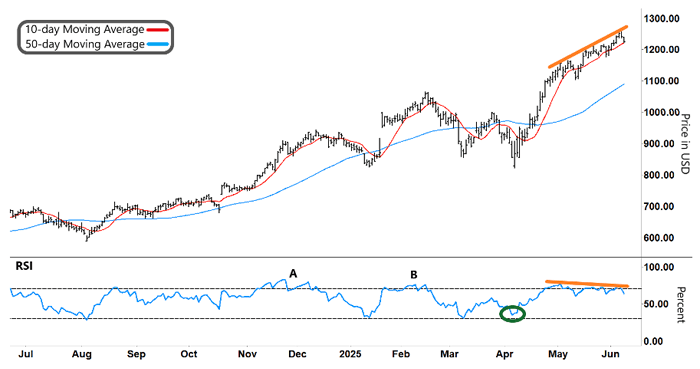
In the chart below, the 50-day moving average (MA, blue line) shows NFLX’s underlying uptrend.
NFLX got caught up in the heavy selling in April. But it rapidly resumed its rally, hitting a recent all-time intraday high of $1,262.81. That move represented a 53.8% gain off its April 7 low. And it’s a sevenfold increase (676.2%) since the May 2022 low.
Check out the chart…
Netflix (NFLX)
Source: e-Signal
You can gauge the magnitude of the rally by the steep rate at which the 10-day MA (red line) crossed and accelerated above the 50-day MA. Since then, both MAs have bullishly tracked higher.
Likewise, the start of that rally coincided with the Relative Strength Index (RSI), a momentum indicator, forming a “V” and rallying from near oversold territory (green circle).
Each time that pattern has repeated, NFLX rallied – including August last year and January and March this year.
But a different pattern is forming now…
NFLX’s rally corresponded with the RSI pushing up to overbought territory (upper gray dashed line). Since then, it has made a series of lower highs (lower orange line).
Meanwhile, NFLX has continued to rally, making a succession of higher highs (upper orange line).
So what can we expect from here?
|
Tune in to Trading With Larry Live
Each week, Market Wizard Larry Benedict goes live to share his thoughts on what’s impacting the markets. Whether you’re a novice or expert trader, you won’t want to miss Larry’s insights and analysis. Even better, it’s free to watch. Simply visit tradingwithlarry.com at 8:30 a.m. ET, Monday through Thursday, to catch the latest. Follow us on YouTube to catch any episodes you missed. |
A diverging pattern like this (the orange lines) often precedes a reversal. Declining buying momentum will eventually pull the stock down, too.
However, we need to see the RSI make a decisive move lower before considering a short trade.
That happened at “A” and “B.” After tracking in overbought territory, a falling RSI coincided with NFLX slipping lower.
Take another look:
Netflix (NFLX)

Source: e-Signal
Plus, keep a close watch on our two MAs. If the 10-day MA (red line) breaks lower toward the 50-day MA, that would confirm an emerging down move.
To be clear, we aren’t necessarily bearish on the longer-term prospects of NFLX.
We’re simply looking for a stock that has run too far and too fast. And we aim to profit when it reverses the other way.
So NFLX deserves a spot on our watchlist.
Regards,
Larry Benedict
Editor, Trading With Larry Benedict
|
Free Trading Resources Have you checked out Larry’s free trading resources on his website? It contains a full trading glossary to help kickstart your trading career – at zero cost to you. Just click here to check it out. |
Reading Trading With Larry Benedict will allow you to take a look into the mind of one of the market’s greatest traders. You’ll be able to recognize and take advantage of trends in the market in no time.
