|
Larry’s note: Welcome to Trading with Larry Benedict, the brand new free daily eletter, designed and written to help you make sense of today’s markets. I’m glad you can join us. My name is Larry Benedict. I’ve been trading the markets for over 30 years. I got my start in 1984, working in the Chicago Board Options Exchange. From there, I moved on to manage my own $800 million hedge fund, where I had 20 profitable years in a row. But these days, rather than just trading for billionaires, I spend a large part of my time helping regular investors make money from the markets. My goal with these essays is to give you insight on the most interesting areas of the market for traders right now. Let’s get right into it… |
It’s hard to think of a sector that provides a more realistic picture of economic health than home construction.
When we looked at this sector just over a month ago, it was coming off of one of its biggest growth periods in decades.
So, let’s take another look at the sector using the iShare U.S. Home Construction ETF (ITB) as a reference point.
When we checked out ITB last month, it had been pushing up hard against a resistance level, and we spoke about how two potential scenarios could be unfolding.
Today, I’m going to look at what has happened since… because just last week, one of those scenarios came into play.
Let’s pull up ITB’s price chart…
iShare U.S. Home Construction ETF (ITB)
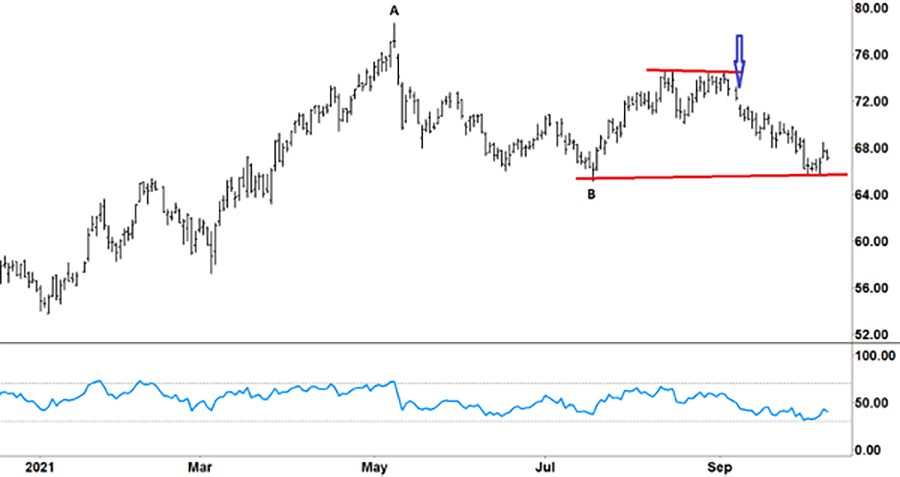
Source: eSignal
After a 14-month rally (where its share price more than tripled), ITB peaked in May at an all-time high (‘A’ on the chart).
And with such a huge run up like that, we discussed how you can expect a decent pullback. That’s exactly what we saw as ITB fell 17% (from ‘A’ to ‘B’).
However, it’s the price action after ‘B’ that really caught my attention…
From that low at ‘B’, ITB again began to rally. At the time of writing (blue arrow), ITB had tried in August, and then again in September, to break up through resistance (upper red line).
From there, I wrote about these two scenarios…
First, to resume its upwards trend, ITB had to break above the upper red line and hold.
From there, ITB would then need to break above its all-time high at ‘A’ to confirm the long-term uptrend was intact. That could have provided an opportunity to go long…
Since it failed to break resistance, ITB instead rolled over and trended down. This brings our second scenario to the table…
So, let’s take another look at the chart…
iShare U.S. Home Construction ETF (ITB)
This second scenario relates directly to the support level (lower horizontal red line), that coincides with ITB’s low in July (‘B’). The level was tested last week…
As ITB traded down and bounced off the support level, the Relative Strength Index (RSI) at the bottom half of the chart moved up.
However, while that action in the RSI tells you that the momentum is increasing, I’m not convinced yet…
For ITB to rally, we’ll first need to see the RSI move upwards more aggressively. If not, there’s every chance that ITB will retest this support level over the coming week.
And that’s why this support level becomes so important…
If ITB retests and holds this support, I’ll be watching to see if it tries again to break the upper red line. If it can’t, then that means a new chart pattern could be emerging – a sideways range-bound pattern.
And that could provide plenty of opportunity to place some mean reversion trades.
However, if ITB retests support and breaks lower (below ‘B’), then that could bring a wave of selling to the market.
So, that means that a long-term downtrend might only just be getting underway… and it could give us a chance to go short.
That’s why the price action around support this week is so important.
Right now, we have two potential trades riding on it.
Stay tuned…
Regards,
Larry Benedict
Editor, Trading With Larry Benedict
P.S. We’re excited to hear what you think of your new eletter, Trading With Larry Benedict. Let us know at feedback@opportunistictrader.com.
Reading Trading With Larry Benedict will allow you to take a look into the mind of one of the market’s greatest traders. You’ll be able to recognize and take advantage of trends in the market in no time.
