As one of the biggest hitters on the market, Amazon (AMZN) played a significant role in dragging the major indices lower.
Its massive 45% fall from its November 2021 peak especially hurt buy-and-hold investors.
When we checked AMZN on June 22 (red arrow on the chart), it was trading back at pre-pandemic levels after this dramatic fall.
Also, it was showing some positive signs…
Despite high inflation and rising interest rates, AMZN was gradually establishing a base from which to rally.
However, any potential rally quickly fizzled out and left AMZN tracking sideways.
AMZN’s earnings results are just around the corner on August 4. So, today I’m going to see where it’s heading next.
Let’s pull up AMZN’s chart…
Amazon (AMZN)
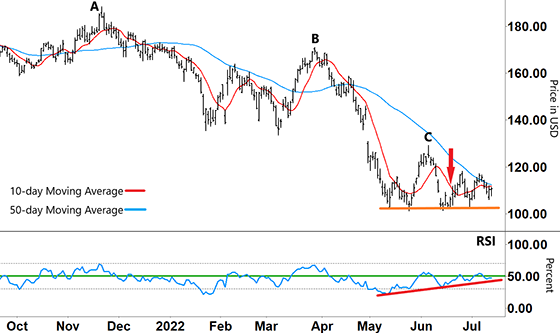
Source: eSignal
You can see how AMZN’s downtrend started in late 2021.
After its peak on November 19 marked by ‘A,’ the 10-day moving average (MA – red line) crossed down below the 50-day MA (blue line) in December.
Since then, the 50-day MA has been mostly trending lower.
And despite a temporary break back above the 50-day MA in March and April, the 10-day MA has remained below the 50-day MA throughout the entire move (bearish signal).
After making a lower high in late March at ‘B,’ the Relative Strength Index (RSI) reversed, forming an inverse ‘V’ near overbought territory (upper grey dashed line).
As the RSI tracked lower and broke down through support (green line), AMZN’s share price fell sharply.
Take another look at the chart…
Amazon (AMZN)
Source: eSignal
Only when the RSI fell into oversold territory (lower grey dashed line) and formed a ‘V’ around mid-May, did selling pressure start to subside.
This enabled AMZN to form a base at the orange line.
Then, AMZN tried to rally from that base when the RSI showed increasing buying momentum (red line) from May to June.
However, the RSI stuck around resistance (green line) and then strongly reversed.
So, AMZN made a new lower high at ‘C’ before falling back to short-term support.
Since then, AMZN has tried to rally twice. But each rally ran out of steam when the RSI failed to gain traction above resistance.
Now, what can we expect from here?
For AMZN to rally, the RSI first needs to break into the upper half of its range and stay there.
The longer it remains in this upper band, the higher the chance of a prolonged rally.
Second, the 10-day MA needs to break strongly above the 50-day MA and accelerate higher.
Such a move could soon see AMZN take out its peak at ‘C’ and trade back above $130.
However, if the RSI again inverses around resistance, then there’ll be little momentum to drive AMZN higher.
Instead, AMZN will continue to drift and retest support.
Regards,
Larry Benedict
Editor, Trading With Larry Benedict
Where do you think Amazon will head next?
Let us know at feedback@opportunistictrader.com.
Reading Trading With Larry Benedict will allow you to take a look into the mind of one of the market’s greatest traders. You’ll be able to recognize and take advantage of trends in the market in no time.
