|
Larry’s note: Welcome to Trading with Larry Benedict, the brand new free daily eletter, designed and written to help you make sense of today’s markets. I’m glad you can join us. My name is Larry Benedict. I’ve been trading the markets for over 30 years. I got my start in 1984, working in the Chicago Board Options Exchange. From there, I moved on to manage my own $800 million hedge fund, where I had 20 profitable years in a row. But these days, rather than just trading for billionaires, I spend a large part of my time helping regular investors make money from the markets. My goal with these essays is to give you insight on the most interesting areas of the market for traders right now. Let’s get right into it… |
Last Thursday, we checked out the latest action in silver.
Today, though, I want to turn our attention to gold…
If you recall, we looked at gold almost a month ago. We used gold as an example of how you can trade a range-bound market with the help of the relative strength indicator (RSI).
Back then, gold had recently bounced off support. We saw how that coincided with an oversold signal from the RSI.
After bouncing, however, gold’s rally lost momentum. It then traded down late last week.
For a long-term trend trader, it’s the type of price action that can be immensely frustrating. That’s because after a month of action, gold is almost right back to where it started.
However, this can be a particularly rewarding chart pattern… if you know how to trade it.
So, let’s take a look at the SPDR Gold Shares ETF (GLD) – an ETF that tracks the gold price…
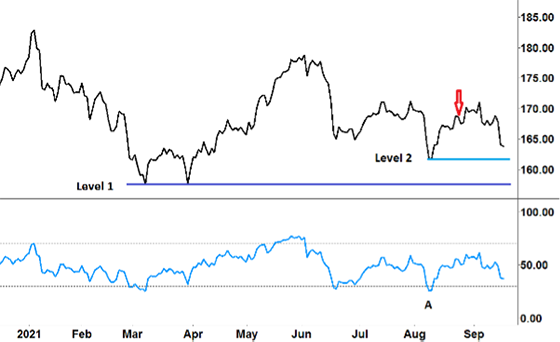
GLD Price Chart
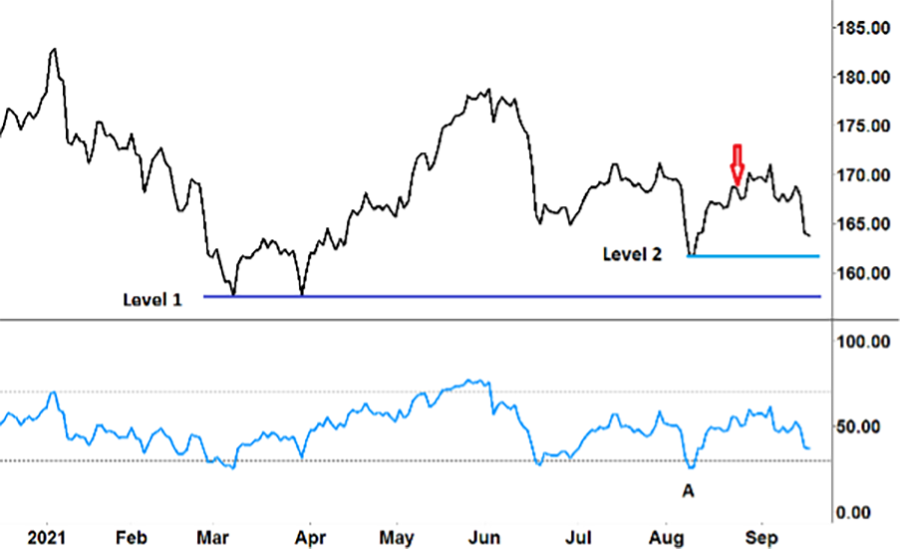
Source: eSignal
On the chart, I’ve put a red arrow where I last wrote about gold (August 25).
Around that time, GLD had bounced off support, along with the RSI forming a V-shaped trough (‘A’).
As we saw, though, the GLD rally ran out of steam shortly after. And, GLD rolled over along with the RSI. In other words, declining momentum brought GLD’s share price down.
So, what am I looking for next?
The answer lies within the price levels…
I have drawn two price levels on the chart. Level 1, the dark blue horizontal line ($158), is a long-term level going back to March this year.
Level 2 – the light blue horizontal line ($162) – represents a short-term level (GLD’s recent low).
When we consider price levels, we need to remember that the longer a support or resistance holds, the stronger it becomes.
And if that level is tested in quick succession, then that too can indicate a strong support or resistance level.
That’s exactly what GLD did in March. After holding support twice, GLD rallied from around $158 to over $178.
Right now, though, my immediate focus is to see if GLD can hold level 2…
If GLD can hold level 2 – its most recent low – then that becomes a much stronger support level.
Combined with a signal from the RSI (a V-shaped trough), that could provide an opportunity to go long in GLD.
However, if GLD fails to hold level 2, then that puts level 1 back into the crosshairs. Holding that will become an even bigger test for GLD…
As we know, once a stock breaks long-term support – in this case, a fall below level 1 – that could produce a sizeable sell-off.
Of course, right now it’s early. First, let’s see if level 2 holds. If not, then we can start planning for level 1.
Either way, though, one thing is clear…
We know that the market is soon going to test the strength of gold buyers.
And that could mean plenty of trading opportunities for us.
Regards,
Larry Benedict
Editor, Trading With Larry Benedict
Today we receive some kind words from readers…
I like these newsletters. They are long enough to present actionable information while not getting in the way of a busy day. A lot of commentaries I skip or delete, but I open these every time.
– William H.
I’m taking the newsletters to heart. Larry has very good information in the newsletters. It helps to know which way the market is going. Thank you.
– Kendall V.
I enjoy your newsletter, Larry.
I get many investment newsletters each day. In fact, most of them are ultimately just promotions for other newsletters.
Your information is actually helpful when it comes to basic investment strategies, cutting through the BS, and showing the truly important dates and sources to follow.
Much better to teach a man to fish than to give him one…
– Brad C.
I enjoy reading your full comments on markets and how you trade them. I also learned about looking at different indicators you use in helping to prepare you make your investment decisions.
– Gene S.
P.S. We’re excited to hear what you think of your new eletter, Trading With Larry Benedict. Let us know at feedback@opportunistictrader.com.
Reading Trading With Larry Benedict will allow you to take a look into the mind of one of the market’s greatest traders. You’ll be able to recognize and take advantage of trends in the market in no time.
