Larry’s Note: These days, it feels like there’s no safe place for your money. The market has whipsawed most investors… and crypto has crashed once again. Many people are fleeing to cash as a result.
But the meager yields of savings accounts or bonds aren’t even keeping up with inflation. That’s why I want to share a little-known strategy I’m using in this environment that could actually make a profit right now.
It’s not options, crypto, or anything else most people have heard of… It’s one financial instrument that’s been providing me a steady income stream since 2011… and has yields 750% higher than the average savings account right now.
So, at my 750% Boost briefing on Wednesday, December 7 at 8 p.m. ET, I’m revealing what this instrument is… why it offers a great balance of risk and reward… and how to get started.
If you’re tired of losing out this year, save the date and sign up to attend for free with one click right here.
Yesterday we saw how Caterpillar (CAT) has been on an absolute tear. In just a month and a half, CAT rallied a massive 50%.
And today, I’m going to turn our attention to another “old economy” constituent of the Dow Jones Index… International Business Machines (IBM) has also enjoyed a strong run recently.
From its October low to its recent high, IBM has gained 30% – a level it hasn’t traded at since February 2020.
However, much like CAT, this huge surge in IBM shares in such a short period has put it into overbought territory.
And now, IBM is in danger of reversing. So today, we’ll examine what’s coming next…
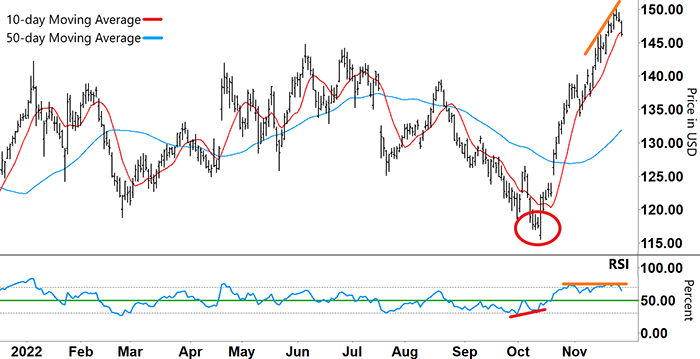
Up until the recent rally, IBM had generally traded in a sideways pattern this year…
The 50-day moving average (MA – blue line) meandered in a tight range, with the 10-day MA (red line) crisscrossing it eight times since the start of 2022.
Check out the chart…
International Business Machines (IBM)
Source: eSignal
The down move in August represented the seventh of those MA crossovers… and sent IBM down to its lowest level this year.
However, the Relative Strength Index (RSI) formed a ‘V’ and then trended higher (red line) out of oversold territory (lower grey dashed line). IBM’s selling petered out and then reversed (red circle).
Then, as buying momentum increased, IBM began to rally…
An earnings beat (Q3) in late October saw IBM gap higher – a move that coincided with the RSI bullishly breaking into and gaining a foothold in the upper half of its band (above the green line).
IBM then continued to rocket higher causing the 10-day MA to break above the 50-day MA at almost right angles.
Take another look…
International Business Machines (IBM)
Source: eSignal
That sharp rally higher put the RSI into overbought territory (upper grey dashed line) in late October.
Since then, the RSI has seesawed sideways in and out of overbought territory (lower orange line). All the while, IBM has continued to make new highs (upper orange line).
So with the RSI and IBM stock price heading in different directions, what can we expect from here?
Free Trading Resources
Have you checked out Larry’s free trading resources on his website? It contains a full trading glossary to help kickstart your trading career – at zero cost to you. Just click here to check it out.
When the stock price and RSI diverge, a change of direction is often in the cards…
However, it’s the timing of any potential reversal that I’m looking to pinpoint.
When the RSI formed an inverse ‘V’ along the lower orange line, IBM’s stock price also briefly reversed lower…
But the RSI subsequently rebounded higher, and IBM made another move higher. If that pattern continues, then the current down move in IBM will be short-lived.
However, if the RSI instead tracks lower toward support (green line), then we can expect IBM’s recent down move to gather momentum. This would provide the setup for a potential short trade.
And the RSI breaking into the lower half of its range would see an extension of any down move.
Regards,
Larry Benedict
Editor, Trading With Larry Benedict
In today’s mailbag, a reader shares their thoughts on Larry’s analysis of the Financial Select Sector SPDR Fund (XLF)…
I believe XLF will not continue sideways but instead of an uptrend it’ll go downward because it has completed two “V’s” which is a “W” at the pivot points. This is a downtrend coming into place, at least one half from the top to the bottom.
– Phyllis S.
And we’d like to welcome Sam, a new subscriber to The S&P Trader service…
Hi there,
I’m new to The S&P Trader and liking it a lot already. I’m just getting myself oriented with the trading and setting up correctly with the right options account.
– Sam O.
Thank you, as always, for your thoughtful comments. We look forward to reading them every day at feedback@opportunistictrader.com.
Reading Trading With Larry Benedict will allow you to take a look into the mind of one of the market’s greatest traders. You’ll be able to recognize and take advantage of trends in the market in no time.
