|
Larry’s note: Welcome to Trading with Larry Benedict, the brand new free daily eletter, designed and written to help you make sense of today’s markets. I’m glad you can join us. My name is Larry Benedict. I’ve been trading the markets for over 30 years. I got my start in 1984, working in the Chicago Board Options Exchange. From there, I moved on to manage my own $800 million hedge fund, where I had 20 profitable years in a row. But these days, rather than just trading for billionaires, I spend a large part of my time helping regular investors make money from the markets. My goal with these essays is to give you insight on the most interesting areas of the market for traders right now. Let’s get right into it… |
The property market can be a good indicator of economic health.
That’s because when property is booming, there’s a good chance the economy is too.
However, should property prices begin to fall, it can often be a sign of a slowing economy.
And, that affects the stock market…
Earlier this month, we took a look at the iShares U.S. Real Estate ETF (IYR). Because it includes a wide range of property types, it helps me see the bigger picture on the broader property market.
When we first looked at IYR, it was making all-time highs.
From its March 2020 low, IYR had rallied 98% – a huge move for property in just 18 months.
However, the relative strength index (RSI) was also telling me that IYR was running out of juice.
To see what’s happened since, let’s pull up the chart…
IYR Price Chart
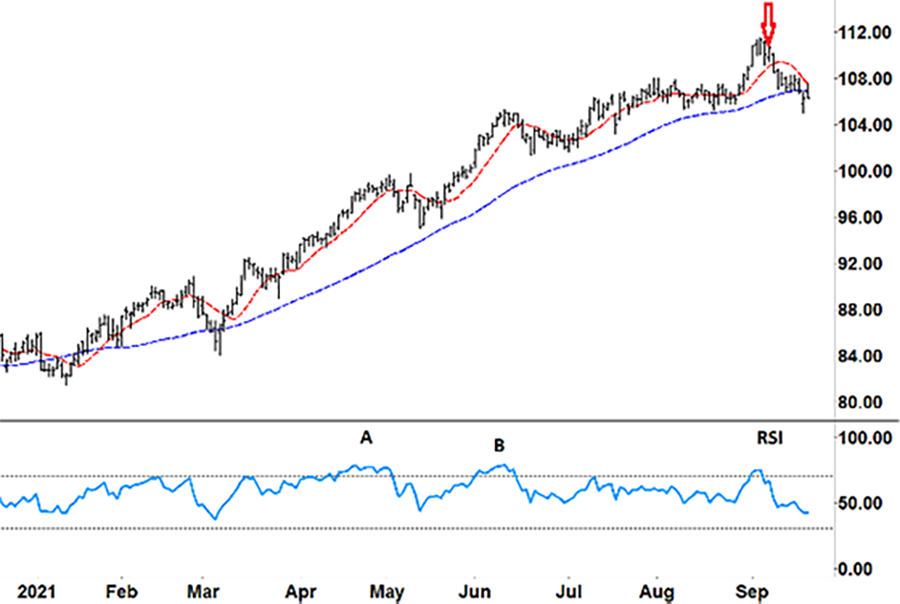
Source: eSignal
When I first wrote about IYR (the red arrow), we saw that each time the RSI went into overbought territory (above the upper dotted black line), the IYR share price fell.
First, in April and May (‘A’), and then again in June (‘B’). Each time the RSI peaked, IYR fell approximately 5%.
Given that the RSI was again overbought, we were checking to see if history might repeat itself – which it did. With the current pullback, IYR has fallen by around 5% again.
When we previously looked at IYR, we were also trying to determine the longer-term trend.
On the top half of the chart are two moving averages (MA) – the short-term 10-day MA (red line), and the long-term 50-day MA (blue line).
Apart from a small crossover in January 2021, the 10-day MA has stayed above the 50-day MA all year. That includes those two pullbacks (‘A’ and ‘B’) when IYR fell around 5%.
So, the long-term uptrend had remained intact…
However, this current pullback has two distinct differences from the previous two:
First, IYR has traded below its 50-day MA (which it didn’t do previously).
And second, the 10-day MA looks to be on the verge of crossing down over the 50-day MA – typically a bearish signal.
If the 10-day MA crosses down, and then the 50-day MA rolls over, then that could be the start of an even bigger down move over the coming weeks.
In addition to the moving averages, I’ll be watching the RSI too.
While initially falling sharply off its September peak, the RSI has changed profile more recently…
Over the past 7-10 days, the RSI has drifted around the middle of the RSI range. Meaning, right now, it’s not close to oversold territory – something which might cause a bounce in IYR’s share price.
Of course, it’s still early. That’s why I’ll be keeping a close eye on IYR over the coming week.
We will need to see the 10-day MA cross down over the 50-day (and stay there) before we can confirm a change in trend.
Should that happen, the current 5% fall could be just the start of bigger move down.
Regards,
Larry Benedict
Editor, Trading With Larry Benedict
P.S. We’re excited to hear what you think of your new eletter, Trading With Larry Benedict. Let us know at feedback@opportunistictrader.com.
Thank you to all the readers who’ve been writing in about their trading experience…
I live in India and invest through Indian stock exchanges. Your letters are guideposts I use to invest.
– Krishnalal M.
Your newsletter is great. It gets to the point and stays on topic. I’m tired of hearing about all the past stocks I could have bought low and made a fortune. Keep it going.
– Jack H.
I really do appreciate how informative and communicative you guys have been about both the market and your stock picks. I learn every time I read your letters, and I did make 50% off the second Quad Witching trade…
I’m looking forward to more trades this week!
– Kevin H.
Reading Trading With Larry Benedict will allow you to take a look into the mind of one of the market’s greatest traders. You’ll be able to recognize and take advantage of trends in the market in no time.
