Rising interest rates around the world are being blamed for a jump in stock market volatility.
Just two weeks after Treasury Secretary Scott Bessent announced measures to stem a jump in long-dated bond yields, rates are increasing once again.
The 10-year Treasury yield just hit 4.8% – the highest level since 2023.
It’s not much better on the short end either. Following a highly anticipated speech at the Federal Reserve’s Jackson Hole Symposium, Fed Chair Kevin Warsh kept up the hawkish rhetoric against inflation.
Odds for a rate hike at the Fed’s next meeting in a few weeks spiked in response.
While many are blaming the jump in rates across the yield curve for the pullback in stock indexes, that’s not the full story.
Here’s what the calendar says about stock market trends, and what investors can expect next…
(If you enjoy this e-letter, I’d be very grateful if you recommended it to a friend. You can click here to forward it. Thank you!)

In 2022, when the Federal Reserve made its most dramatic pivot in history and the S&P lost nearly 20%, Larry Benedict didn't lose a single trade. He knew where the money was going and positioned his readers to profit. Trump is now installing his own Fed Chair, something Wall Street is already calling a generational shift. Larry says his readers will be ready for it. Click here to find out the one ticker he's positioning in, completely free.

Your bank pays you 0.4%... if you're lucky. But these big banks have been keeping a secret... one they NEVER advertise to the general public. Bank of America, Wells Fargo, and JPMorgan use something called "The 29% Account." Since 2000... it has turned $1,000 into $565,000. Click here to see how you can open your own "29% Account" today...
Seasonality refers to the stock market’s tendency to rise or fall over certain parts of the calendar year. For example, you’ve probably heard the phrase, “Sell in May and go away.”
That refers to the S&P 500’s historical tendency to have a difficult six-month stretch from May through October.
On the other side, the six months from November to April are often bullish when you look back historically.
That’s a big-picture way of using seasonality. Yet traders can narrow their focus to track seasonality over specific months or other shorter-term trends as well.
The chart below shows how the S&P 500 has performed on average throughout the year for the past 20 years. The vertical line shows where we are today.
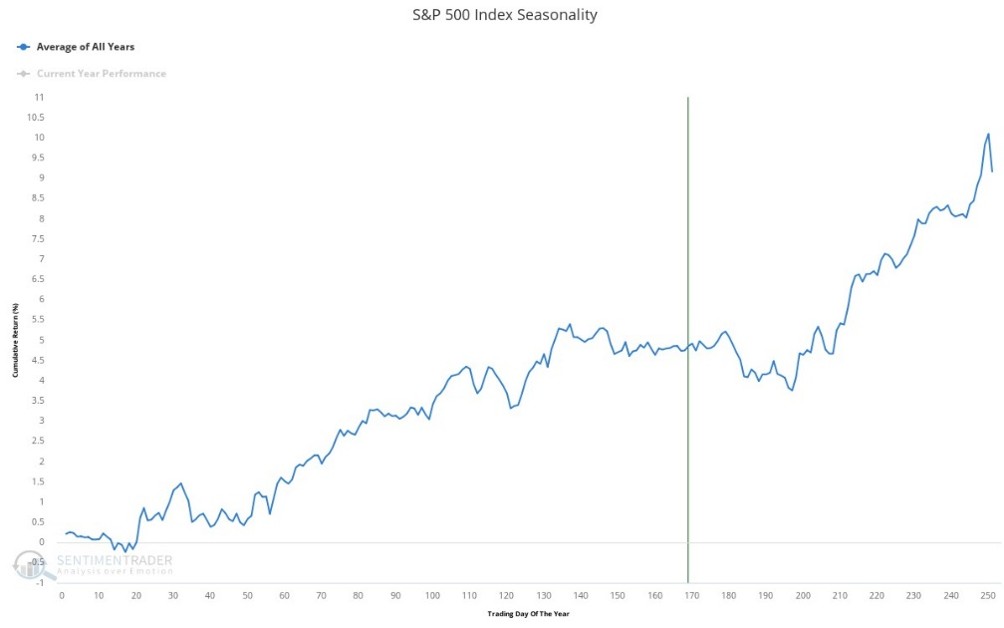
Notice that seasonal tendencies also unfold over shorter time frames.
Following a strong start to August, the S&P 500 has been drifting slightly lower, which is in line with seasonal trends. But don’t expect the rangebound, low-volatility environment to last long.
That’s because weak seasonality is arriving right on cue – with an extra element of uncertainty over the coming months…
The month of September is hands-down the worst month of the year for the S&P 500 on average. And it isn’t even close.
The chart below shows average returns by month for the S&P 500 going back 60 years:
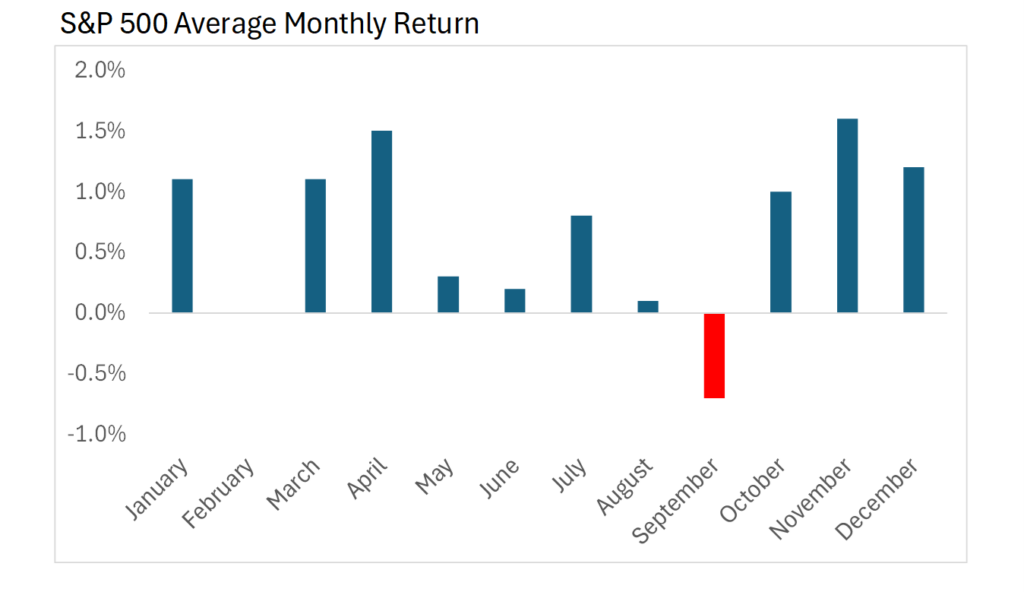
Historically, September has delivered an average return of -0.70% for the month. That’s the worst average return and the only negative month.
It also has the worst “hit rate.” That refers to the percentage of time that the S&P 500 generates a positive return for the month, which stands at just 46% for September.
And here’s another thing to note about September. When you string together weekly returns during the year, the last two weeks of September are the worst stretch historically.
Not only that, but the coming midterms this year add another complicating factor, as seasonal weakness is also common heading into elections.
So while interest rates may play a role in the recent downside in the S&P 500, it’s certainly not the only factor to consider.
And if the S&P 500 keeps reflecting historical trends, then investors should be prepared for more volatility in the coming weeks…
Happy Trading,
Larry Benedict
Editor, Trading With Larry Benedict
Reading Trading With Larry Benedict will allow you to take a look into the mind of one of the market’s greatest traders. You’ll be able to recognize and take advantage of trends in the market in no time.