|
Larry’s note: Welcome to Trading with Larry Benedict, my free daily eletter, designed and written to help you make sense of today’s markets. I’m glad you can join us. My name is Larry Benedict. I’ve been trading the markets for over 30 years. I got my start in 1984, working in the Chicago Board Options Exchange. From there, I moved on to manage my own $800 million hedge fund, where I had 20 profitable years in a row. And, I’m featured in the book Market Wizards, alongside investors like Paul Tudor Jones. But these days, rather than just trading for billionaires, I spend a large part of my time helping regular investors make money from the markets. My goal with these essays is to give you insight on the most interesting areas of the market for traders right now. Let’s get right into it… |
With their massive market caps, Tesla (TSLA) and Amazon (AMZN) are by far the largest members of the Consumer Discretionary Select Sector ETF (XLY).
Combined, they represent around 40% of XLY’s total holdings.
So, when both stocks got caught up in the tech rout that began at the start of the year, XLY also fell heavily… XLY dropped a massive 24% from January 1 to its February low.
After hitting that low, XLY started to form a base (orange line on the chart below). And in just the past week, it’s already rebounded strongly.
Today, I want to see what’s in store for this important sector.
We’ll see if this is the emergence of a new uptrend… or just a relief rally before XLY rolls over and starts heading down again.
First, let’s check out the chart of XLY…
Consumer Discretionary Select Sector ETF (XLY)
Source: eSignal
You can see the strong downtrend that began at the start of the year.
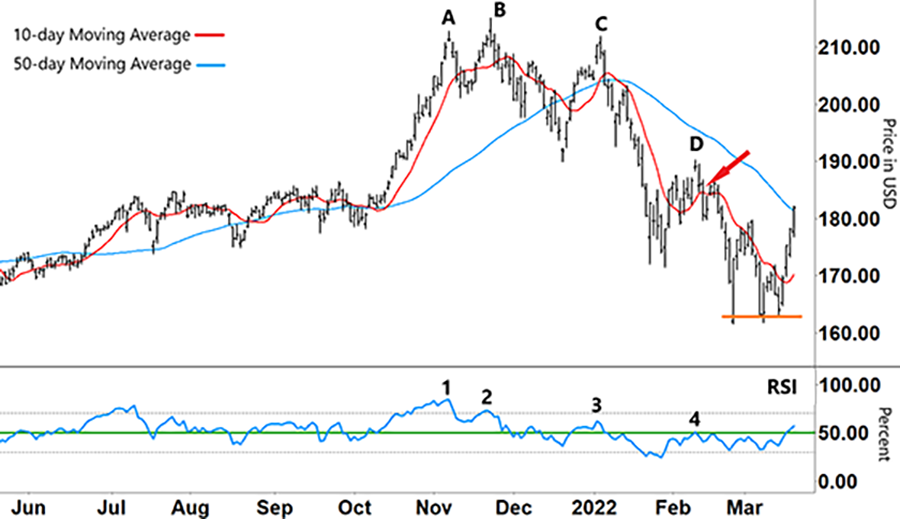
The 50-day moving average (MA – blue line) began trending lower in early January.
You can also see the speed at which the 10-day MA (red line) broke below the 50-day MA, showing the strength of that down move…
XLY has rallied sharply since it found support (orange line). It recently broke above the 50-day MA.
So, what am I looking for from here?
One part of that answer lies with our momentum indicator – the Relative Strength Index (RSI).
Although XLY made a higher high at ‘B’ on the chart than ‘A’, it did so with declining momentum (‘1’ and ‘2’ in lower half of the chart). Divergence between the share price and the RSI is often the precursor to a change in direction.
That’s exactly what we saw…
Consumer Discretionary Select Sector ETF (XLY)
Source: eSignal
From there – with the RSI in a downtrend – XLY made a lower high at ‘C’ (with the RSI lower at ‘3’).
When we last checked in on XLY (red arrow), it had just made another lower high at ‘D’. At that time, we were watching to see if the RSI could break above resistance… (green line) sending XLY higher.
But after failing to break higher – and with the RSI stuck in the lower half of its band (below the green line) – XLY ran out of momentum and fell to its recent low.
With the recent rally off support, the RSI has broken back into the upper half of its range. For XLY to rally further from here, the RSI will need to remain above the green line.
The other part of the answer comes back to our MAs…
While XLY has recently broken above its 50-day MA, we’ll also need the 10-day MA to break back above the 50-day MA to see further proof of an emerging uptrend.
The next test for XLY would then be to break back above its most recent high at ‘D’ on the chart.
If XLY instead peaks at a lower high than ‘D’ – and the RSI forms an inverse ‘V’ before heading lower – then that will confirm that this current leg is just a relief rally.
Meaning, the current bounce will run out of steam, and XLY will continue with its major downtrend.
If that happens, we’ll need to be ready to sell into any strength.
Regards,
Larry Benedict
Editor, Trading With Larry Benedict
Do you think discretionary stocks will start a new uptrend?
P.S. We’re excited to hear what you think of your new eletter, Trading With Larry Benedict. Let us know at feedback@opportunistictrader.com.
Reading Trading With Larry Benedict will allow you to take a look into the mind of one of the market’s greatest traders. You’ll be able to recognize and take advantage of trends in the market in no time.
