Even when the broader market performs badly, at least one sector usually enjoys a nice run.
Just as all the major indices rolled over and headed south this year, the metals and mining sector burst higher.
After rallying off long-term support in January, the SPDR S&P Metals and Mining ETF (XME) gained close to 70%… putting it at its highest level in over 10 years.
However, after topping out in April, XME strongly reversed and gave up all those gains. And after holding support in July, XME showed promising signs of a new rally last month.
However, that rally is stalling. So today, we’ll check out what’s coming next…
On the chart below, a common pattern warned of XME’s potential fall.
While XME made higher highs from March through April, the Relative Strength Index (RSI) made lower highs (diverging orange lines).
SPDR S&P Metals and Mining ETF (XME)
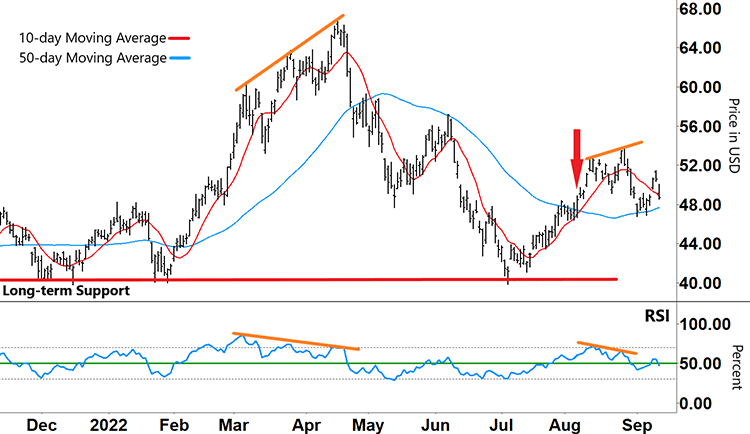
Source: e-Signal
Then, XME fell heavily as the RSI formed an inverse ‘V’ from overbought territory (upper grey dashed line) and tracked down through support (green line).
Apart from a brief period around June, the RSI bearishly remained stuck in the lower half of its range throughout the down move.
The 10-day moving average (MA – red line) crossed and stayed below the 50-day MA (blue line), which added further confirmation of XME’s downtrend.
But with XME retesting and holding long-term support (red line) in July, XME’s rally began.
On August 9, XME showed two promising signals…
The RSI was tracking higher and had just broken back into its upper range.
The 10-day MA was on the verge of crossing back above the 50-day MA.
Yet since then, things have turned around again.
Although the 10-day MA initially crossed above the 50-day MA and began to accelerate, the MAs have begun moving closer together.
And the same pattern we saw from March through April is repeating…
SPDR S&P Metals and Mining ETF (XME)
Source: e-Signal
XME and the RSI headed in opposite directions (orange lines) again. So, the promising rally stalled and XME’s stock price dropped.
Now that the RSI is tracking around support, what can we expect from here?
Free Trading Resources
Have you checked out Larry’s free trading resources on his website? It contains a full trading glossary to help kickstart your trading career – at zero cost to you. Just click here to check it out.
The RSI is now at a crossroads…
For XME to resume its rally, first the RSI must break back into its upper range and stay there. We’ll also want to see the 10-day MA track further above the 50-day MA.
However, if the RSI breaks lower and gets stuck in the lower half of its band, then we can expect XME’s recent pullback to continue.
XME is trading around 25% above its July low. This may not last.
If the RSI gets stuck in its lower band, then XME could retest its long-term support. That would provide the setup for a potential short trade.
And if the 10-day MA crosses below the 50-day MA, then it’ll confirm an emerging downtrend.
After early promising signs, XME’s recent rally petered out after the RSI lost momentum. I’ll be keeping a close watch on XME to see how things play out from here.
Regards,
Larry Benedict
Editor, Trading With Larry Benedict
Do you think XME will rally or stall?
Let us know at feedback@opportunistictrader.com.
Reading Trading With Larry Benedict will allow you to take a look into the mind of one of the market’s greatest traders. You’ll be able to recognize and take advantage of trends in the market in no time.
