Managing Editor’s Note: Tech investing expert Jeff Brown has his eye on a “superchip” that he says is 50 times faster than Nvidia’s. He believes it could shake up the AI race.
You can get all the details in a broadcast this Wednesday, October 28, at 10 a.m. ET. Simply go here to add your name to the guest list.
Most traders are just trying to stay ahead of the curve.
Some comb the latest news and company reports for clues about where a stock or sector is going.
Others study charts to spot patterns and key price levels.
Whatever methods they use, the goal remains the same – to figure out where a stock is heading and capture some of that move.
Traders can also use something that gives an even bigger picture of what might lie ahead – the CBOE Volatility Index (VIX). It’s often referred to as the “fear index”…

Beginning on October 28, a radical new form of AI could handle everyday tasks for millions of people and send one California company up 1,000%. Hailed by Nvidia's CEO as "the new computer," this AI agent could book your appointments, fight your insurance-claim battles, and more. A new AI superchip 50 times faster than Nvidia's could dominate the story. Find the full details here.

Google’s engineers are behind another massive breakthrough: A machine that could make the cost of energy virtually free. And generate 105x growth… Now, Google’s partner is going public, perhaps as soon as December 18. Goldman Sachs and Nvidia are heavily invested. Even President Trump is expected to take a personal stake. You can get in ahead of time. And Jeff Brown will give you the ticker symbol for free. Watch this video to get your free stock.
The VIX often flags when fear is building in the market.
While most forms of analysis focus on past trends (like historical information and prices), the VIX is forward-looking. It gauges what traders are expecting the market to do in the next 30 days.
The distinction comes from how it’s constructed. The VIX measures the volatility of the S&P 500 using index options. The higher the VIX is, the higher the expected volatility will be over the coming month.
When traders think the market will rise, they buy call options. And when traders are nervous about a potential fall, they buy put options.
The more nervous they become, the more they’ll pay for those put options. That’s what sends the VIX higher.
But just because traders are nervous and buying put options doesn’t always mean the market will fall – though it can become self-fulfilling.
If traders are expecting a fall, they’ll also sell out of their long positions. That can add to the wider selling momentum and send the broader market lower.
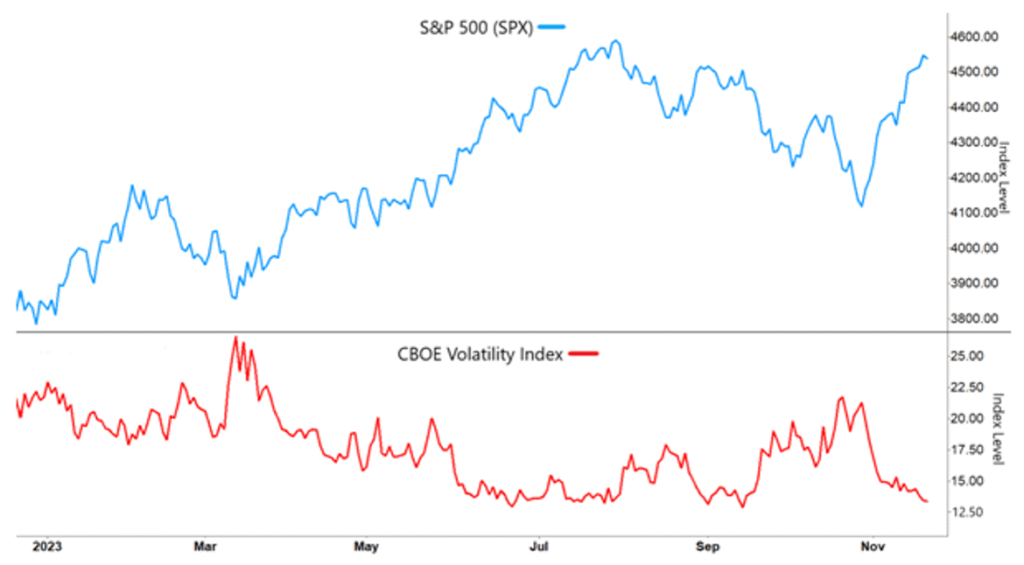
Even if you don’t trade options, the VIX is still useful. To see what I mean, look at a historical chart of the S&P 500 with the VIX below it:
S&P 500 (SPX) with CBOE Volatility Index (VIX)
Source: eSignal
The blue line represents the S&P 500 (SPX), and the red line is the CBOE Volatility Index (VIX). Let’s look at the relationship between the two.
You can see that when the VIX spiked back in March 2023 (nervous traders), it coincided with SPX pulling back sharply.
Then, as volatility gradually fell from March to August, the SPX steadily rose.
They don’t move in perfect lockstep. But when one goes up, the other tends to go down. That applies to both larger and smaller moves.
Basically, when the VIX spikes, we can expect the S&P 500 to fall. And for a trader, this type of information can be crucial.
If volatility is starting to rise, you may delay going long in a stock. Or if you’re looking to short a stock, you might use a spike in volatility to help decide when to enter.
But traders closely watch for more than just the initial spike in the VIX…
Spikes in the VIX are typically short-lived. They often fade within days or weeks. So what happens after the spike is also helpful to traders.
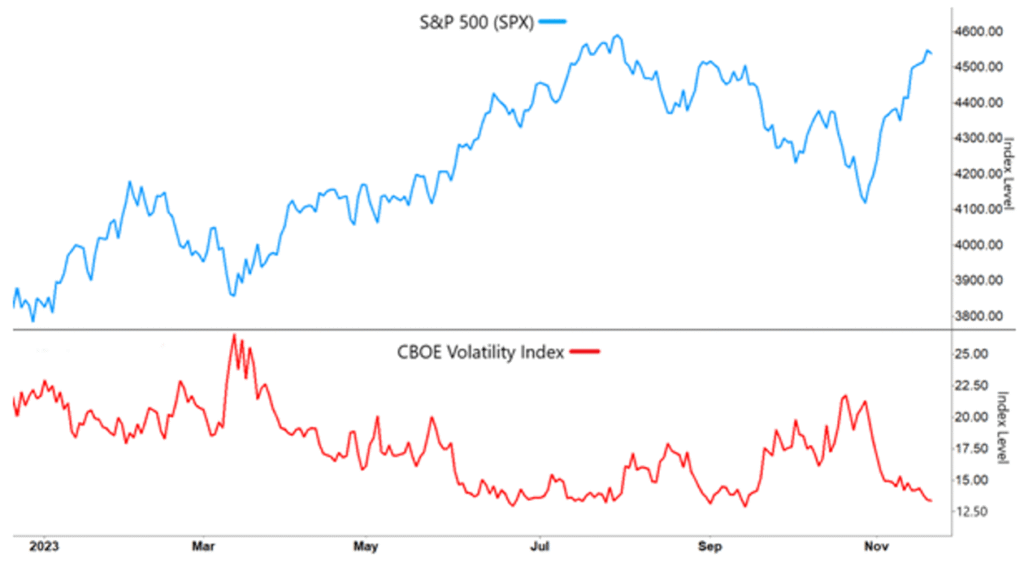
To see what I mean, check out the action on the chart again:
S&P 500 (SPX) with CBOE Volatility Index (VIX)
Source: eSignal
While the SPX initially fell when the VIX spiked in March, it went on to rally as the VIX dropped back into its normal range.
Some traders may use a spike in the VIX as a signal to go short. But others who are bullish on the long-term market trend might see the VIX spike and use the pullback as a trigger to go long.
That’s why the VIX can be a useful tool in either market direction.
Of course, the VIX might not work 100% of the time (nothing does in the markets). But it can offer a much broader understanding of market movements.
And that can be beneficial in improving your trading success.
So the next time the VIX jumps above 20, watch what the S&P does in response…
Happy Trading,
Larry Benedict
Editor, Trading With Larry Benedict
Reading Trading With Larry Benedict will allow you to take a look into the mind of one of the market’s greatest traders. You’ll be able to recognize and take advantage of trends in the market in no time.