It looks like inflation is here to stay.
Last Friday’s Consumer Price Index (CPI) data showed inflation accelerated higher.
Meaning, interest rate rises will remain firmly on the Fed’s agenda.
While those inflation numbers caused the broader market to fall heavily, today I’m going to focus on real estate.
As a sector that’s vulnerable to the interest rate cycle, the iShares U.S. Real Estate ETF (IYR) has seen some big swings in 2022.
When we last checked IYR around two weeks ago (red arrow on the chart), it was rallying off its yearly lows.
I was watching various technical indicators to see how that move might pan out.
But that rally soon fizzled out and saw a sharp reversal.
So, today I want to see what’s in store for IYR.
Let’s check out IYR’s chart…
iShares U.S. Real Estate ETF (IYR)
Source: eSignal
On June 2, we saw how divergence between the stock price and Relative Strength Index (RSI) led to IYR’s change in direction from its April peak.
The strong reversal in the RSI – meaning a reversal in momentum – caused IYR to tumble.
Also, the 10-day moving average (MA – red line) crossed sharply below the 50-day MA (blue line) showing the intensity of that selloff.
However, as the RSI formed a ‘V’ from oversold territory (below the lower grey dashed line), IYR found support.
After an initial bounce followed by a brief pullback, IYR’s bounce started to generate some momentum.
On June 2, the RSI was butting up against resistance (green line).
For IYR’s rally to continue, the RSI needed to break into the upper half of its range. But I warned that the market was particularly fickle.
Meaning, if the RSI failed to break resistance (and instead rebounded lower), IYR’s rally would quickly fade out. In February and March 2022, IYR’s rally reversed under a similar pattern.
As you can see with the recent rally, the RSI tried to break through resistance three times in June before eventually failing and reversing lower.
Let’s take another look…
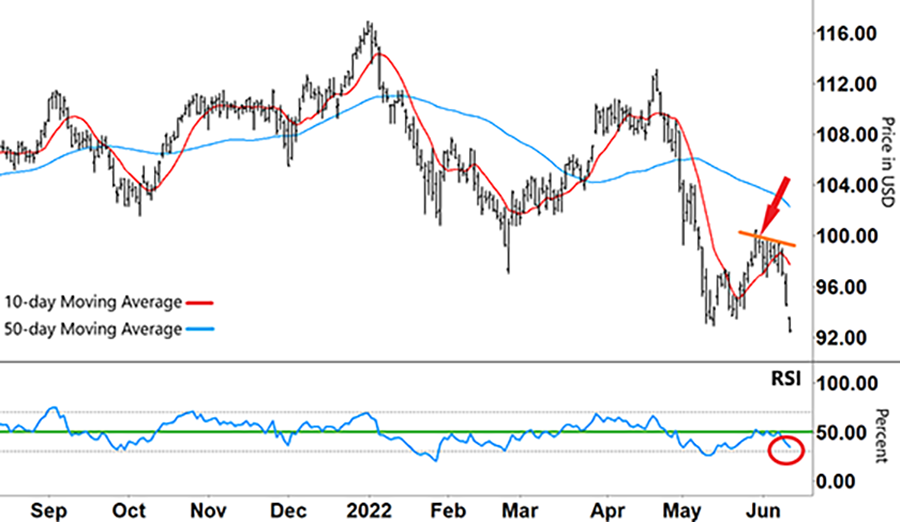
iShares U.S. Real Estate ETF (IYR)
Source: eSignal
At the same time the RSI hit resistance, the IYR stock price ran into its own resistance (orange line).
Then, IYR made a series of lower highs before it also fell sharply.
Now that IYR is seemingly in a freefall, what can we expect from here?
Well, I’m looking at previous patterns to see what’s in store.
When the RSI formed a ‘V’ from oversold territory in late January, late February, and in mid-May – IYR bounced.
Now, these recent falls have the RSI closing in again on oversold territory (red circle).
If a similar pattern repeats, then that could provide the setup for a long trade.
But as I’ve mentioned before, this market is extremely volatile. And that sentiment can change in a heartbeat.
Therefore, our aim is not to capture some long-term move.
Instead, we need to be ready to jump when we have a strong setup… and be ready to bank any potential profits just as quickly.
Regards,
Larry Benedict
Editor, Trading With Larry Benedict
How have you profited in this volatile market?
Let us know at feedback@opportunistictrader.com.
Reading Trading With Larry Benedict will allow you to take a look into the mind of one of the market’s greatest traders. You’ll be able to recognize and take advantage of trends in the market in no time.
