Last Friday marked the highest inflation level we’ve seen since December 1981.
The Consumer Price Index (CPI) jumped to 8.6% annually – rising a whole 1% in just the last month.
This inflation ramp-up has spooked the market…
After months of pricing in a 0.5% rise, this data increased the odds of an even bigger rate rise for this week’s Fed meeting.
The prospect of a bigger rate rise is why we saw a heavy selloff on Friday… and that selling has carried over into this week.
Right now, with so much volatility and emotion driving the markets, it’s easy for traders to get pulled into a bad trade.
That’s why I’ve been closely watching the CBOE S&P 500 Volatility Index (VIX). And today, I’m going to check in on it again.
The VIX not only helps identify potential changes in market direction – but can stop you from jumping into a trade too early.
Let’s take a look at the VIX chart below…
CBOE S&P 500 Volatility Index (VIX)

Source: eSignal
Typically, markets fall more dramatically than they rise. So, you’ll often see a rise in volatility when the market is falling.
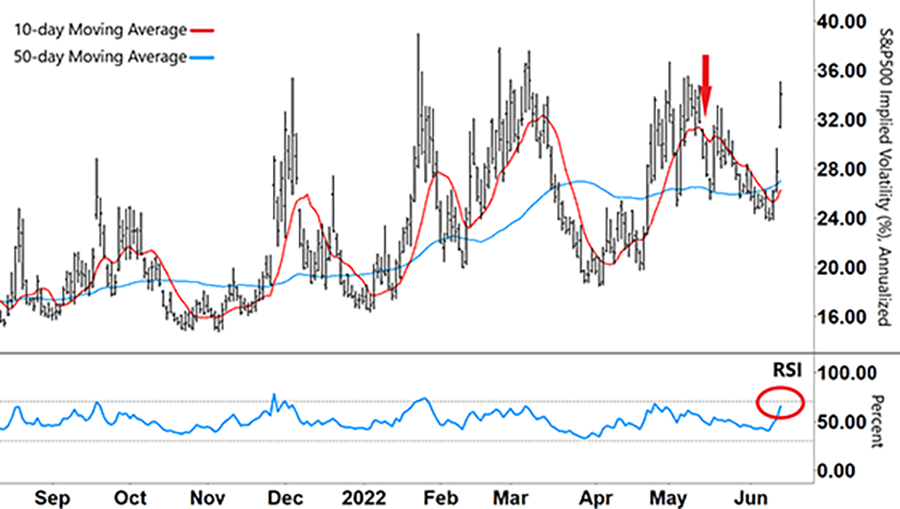
As you can see, volatility has been steadily increasing throughout the market selloffs in 2022.
The long-term 50-day moving average (MA – blue line) shows this by trending higher.
Most traders watch the VIX closely because they know that when it spikes – as it has these past few days – the S&P 500 usually falls heavily.
However, using it to spot falls isn’t the only reason I watch the VIX. It’s what happens after it spikes that’s just as helpful.
When volatility dies down and the VIX starts to fall, the market often tries to find a short-term base…
And that’s where the short-term 10-day MA (red line) comes into the picture.
Since the VIX moves around a lot, the 10-day MA helps make it clearer when volatility is declining.
When we last checked the VIX on May 17 (red arrow), the 10-day MA had peaked and was beginning to head lower.
That move coincided with the S&P 500 finding a base for its rally in mid-May.
Take another look…
CBOE S&P 500 Volatility Index (VIX)

Source: eSignal
But now that the S&P 500 is falling again as the VIX spikes higher, what can we expect from here?
Well, this rally in the VIX is still in its early stages. The 10-day MA just turned higher but has yet to cross above the 50-day MA.
Meaning, this current burst in volatility could still have further to go. So, finding a base for the market right now will be difficult.
But that’s where the Relative Strength Index (RSI) comes into play…
On the chart, the VIX and RSI typically peak at the same time – and often in the RSI’s overbought territory (upper grey dashed line).
Each time the RSI formed an inverse ‘V’ and tracked lower, the VIX rolled over too.
Now that the RSI is closing in again on that upper grey line (red circle), I’ll be watching to see if this pattern repeats.
Right now, we need to be especially cautious…
We want to avoid buying into the market when volatility is increasing – as it’s doing now.
And that’s why the VIX is so useful. By closely watching the 10-day MA and RSI, we can avoid entering a trade too early.
Regards,
Larry Benedict
Editor, Trading With Larry Benedict
Reader Mailbag
In today’s mailbag, a new member to The S&P Trader and The Opportunistic Trader shares his thoughts on starting his trading journey…
Last night, I subscribed to both of your services. Why? Because I met you at the Legacy Investment Summit in Washington, D.C.
Options really scare me, and I want to learn from you. I’m going to study your vertical spread paper again and again to prepare for Monday.
– Scott L.
Thank you for your thoughtful comments. We look forward to reading them every day. Keep them coming at [email protected].