Semiconductor stocks have become the pulse of the stock market.
Massive capital spending on AI infrastructure ends up in various types of chips. Semiconductors represent up to 95% of the internal hardware value for AI server racks.
Rising earnings estimates have been a big catalyst for the broader bull market. But now hyperscaler spending plans are coming under scrutiny. Leading AI companies are talking about slowing the pace of innovation as AI fears escalate.
At the same time, long-term bond yields are rising, and the Federal Reserve’s recent rate hike is pushing up borrowing costs to fund new AI projects.
Any signs of investor fear over AI spending or slowing innovation could impact the rest of the stock market.
That’s why you need to watch chip stocks as they test a key level once again…

A SHOCKING study of every stock on U.S. exchanges over the last 100 years... discovered 96 out of every 100 created ZERO real wealth. But Wall Street doesn't want YOU to know that... Because they need your money LOCKED in their funds, on their timetables... so THEY can collect fat fees whether you win or lose. Meanwhile, "Market Wizard" Larry Benedict has refused to play that game for over 40 years. And he’s made millions for his clients through every market condition you can imagine. Now he's helping folks with opportunities to potentially pocket more in ONE day than the S&P typically delivers in an entire YEAR... with ONE simple, five-minute morning trade... And do it over and over again... without buying, holding, or selling stocks. If you want to know how, he walked everyone through it during his recent "Zero-Stock Retirement Plan" strategy session. See how it works before the free encore comes down.

It is designed to foresees the future prices of 2,334 stocks, to the penny, with 85% backtested accuracy. This year, you could’ve already crushed the stock market by 218%, as of August. Including gains of 46.8% in five days on (RVMD)... 36.8% in 29 days on (ALB)... 32.4% in two days on (BE), and dozens more. Until Tuesday, get free access here (no purchase required).
Ever since late June, the VanEck Semiconductor ETF (SMH) has been struggling for traction.
Holdings in SMH include AI infrastructure stalwarts and companies seeing a direct benefit from AI capex. That includes names like Nvidia (NVDA), Advanced Micro Devices (AMD), and Micron Technology (MU).
Those stocks helped power a massive SMH rally in a short time. Heading into the June peak, it had gained 84% in less than three months.
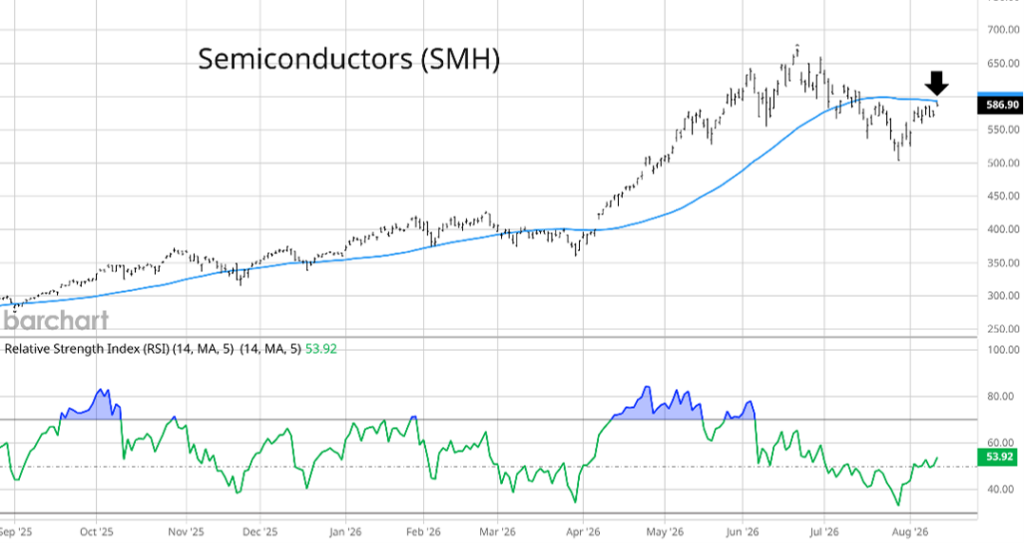
But momentum was extended to the upside, which led to a retracement lower. I had this to say about the SMH chart back in August:
A subsequent pullback in SMH took the ETF lower by 25%, which retraced about 50% of the entire rally since April.
While the RSI didn’t quite extend to oversold territory below the 30 level, it fell to the lowest level since the selloff in April 2025 following the trade war. That sparked a rebound off the $500 level, which has the next big test in play.
The bounce off the $500 level now has SMH pushing up against the 50-day MA from below at the arrow, which gives us the next big test to monitor. It’s common to see key support or resistance levels tested following a break… only for the trend to resume.
So if SMH stalls out below the 50-day, then watch for the $500 support level to come into play once again.
SMH did indeed stall out at the 50-day in the chart shown above, but it led to a shallow pullback instead of a deeper drop to test the $500 level.
Now in the aftermath of the Fed and growing AI concerns, a bearish setup is presenting itself once again.
Semiconductor stocks keep struggling at a key level. Following the test of the 50-day MA back in August, SMH has again rejected that resistance level. Now it is testing it once again.
Take a look at the updated chart:
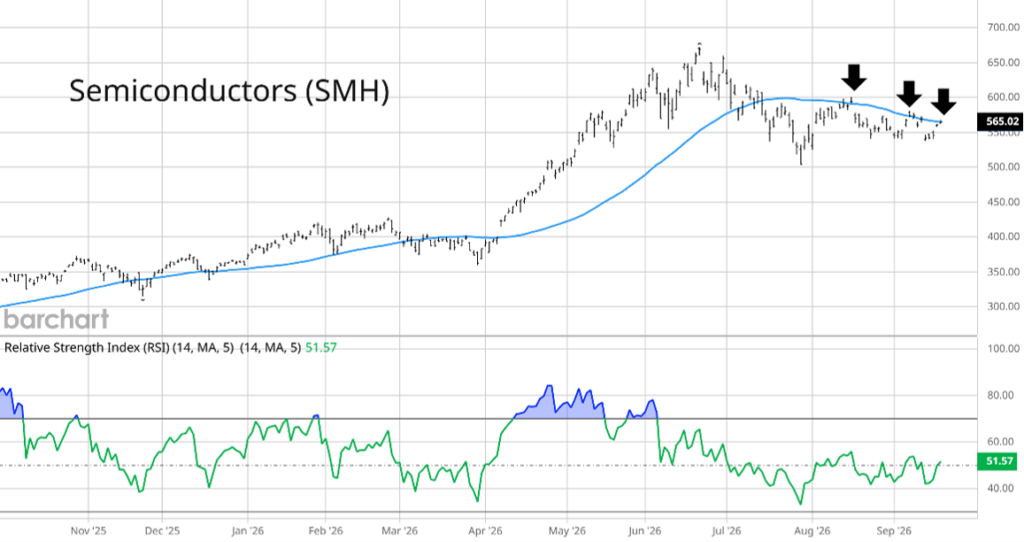
Since the test in August, SMH has come back to the 50-day MA two more times at the arrows.
The good news for bulls is that each rejection has led to a shallow pullback. That shows buyers are quick to step in on any weakness.
But SMH is having a hard time sustaining any upside momentum. That shows a stalemate between the bulls and the bears.
The 50-day continues to be a key battleground level. I believe the risk of a larger downside move in SMH becomes bigger with each failed attempt at the 50-day.
That’s why the 50-day MA remains the level to watch for this potential trade. We may soon see whether or not the AI trend has the legs to continue… or whether that massive rally is finally ready to break.
Regards,
Larry Benedict
Editor, Trading With Larry Benedict
Reading Trading With Larry Benedict will allow you to take a look into the mind of one of the market’s greatest traders. You’ll be able to recognize and take advantage of trends in the market in no time.