|
Larry’s note: Welcome to Trading with Larry Benedict, the brand new free daily eletter, designed and written to help you make sense of today’s markets. I’m glad you can join us. My name is Larry Benedict. I’ve been trading the markets for over 30 years. I got my start in 1984, working in the Chicago Board Options Exchange. From there, I moved on to manage my own $800 million hedge fund, where I had 20 profitable years in a row. But these days, rather than just trading for billionaires, I spend a large part of my time helping regular investors make money from the markets. My goal with these essays is to give you insight on the most interesting areas of the market for traders right now. Let’s get right into it… |
When you first start out trading, it can be overwhelming.
After all, there are countless financial news sites all with their own take on what’s going to happen next in the markets.
And a lot of that information can be contradictory…
One expert thinks the market’s going to keep rallying, while another thinks a crash is just around the corner.
So, who do you follow?
It’s enough to leave you scratching your head.
That’s why I have one simple goal with my essays: to share the tools I use in my own trading so that you can apply them too. And in doing so, help get rid of all that confusing market “noise.”
So far, we’ve looked at indicators like Bollinger Bands, moving averages (MA), and the Relative Strength Index (RSI).
Another indicator I watch every day is the CBOE Volatility Index (VIX). I wrote about this last month, where we saw how a spike in the VIX can often lead to a change of direction in the S&P 500.
Today, I’m going to take another look at the VIX, and why the VIX’s price action this past week warrants some much closer attention.
Let’s pull up the chart…
CBOE Volatility Index (VIX) Chart
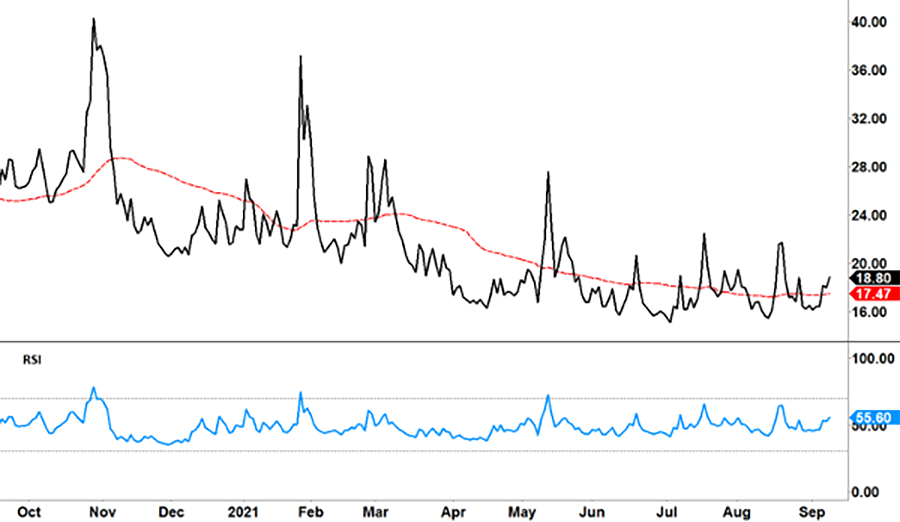
Source: eSignal
The VIX measures the volatility of the S&P 500 through index options.
Even if you don’t trade options, the VIX is a really important tool. That’s because when the VIX spikes, the S&P 500 usually falls.
The chart above shows the VIX (black line), with a 50-day MA (red dotted line) going back to October 2020. As you can see, the MA has been trending down over this time (as the market has moved up)… until recently.
Since mid-August, the MA has gone sideways. If this trend is bottoming out, that could mean more volatility – and potentially bigger corrections – are coming our way.
However, the biggest takeaway from this chart is that the VIX has moved above the 50-day MA this past week. If this turns into a spike, then that could be a strong signal for an impending fall in the market.
To help fill in the clues, I’ve also included the RSI. Regular readers will know that we can use the RSI to gauge if a stock (or index) is “overbought” or “oversold.”
However, it can be useful to consider the RSI more broadly than these simple terms and rather use it as a measure of momentum.
As you can see, along with the recent rise in the VIX (above the 50-day MA), the RSI is also trending up.
This adds to the case that an increase in the VIX – and a pullback in the market – could be gaining momentum.
Right now, the move higher in the VIX is in its early stages. However, once these moves take place, the VIX can spike very quickly.
And that’s why I always watch the VIX very closely.
The VIX puts me ahead of the curve… it warns me of a potential pullback or correction well before others in the market catch on to a potential down move.
Regards,
Larry Benedict
Editor, Trading With Larry Benedict
P.S. We’re excited to hear what you think of your new eletter, Trading With Larry Benedict. Let us know at feedback@opportunistictrader.com
In today’s mailbag, Barry comments on Larry’s trading indicator…
Larry, yesterday I had a terrible day and lost $5,000. Today, I tried to apply your RSI, which really worked well. By midday, I was up $7,000 and really pleased.
I learned how to catch a fish by applying your techniques and not just reading about them and understanding it. I feel like I’m now a fisher of stocks – to borrow from the biblical tale.
– Barry B.
Reading Trading With Larry Benedict will allow you to take a look into the mind of one of the market’s greatest traders. You’ll be able to recognize and take advantage of trends in the market in no time.
