|
Larry’s note: Welcome to Trading with Larry Benedict, my free daily eletter, designed and written to help you make sense of today’s markets. I’m glad you can join us. My name is Larry Benedict. I’ve been trading the markets for over 30 years. I got my start in 1984, working in the Chicago Board Options Exchange. From there, I moved on to manage my own $800 million hedge fund, where I had 20 profitable years in a row. And, I’m featured in the book Market Wizards, alongside investors like Paul Tudor Jones. But these days, rather than just trading for billionaires, I spend a large part of my time helping regular investors make money from the markets. My goal with these essays is to give you insight on the most interesting areas of the market for traders right now. Let’s get right into it… |
Yesterday, we saw how rising wheat prices were adding pressure to food inflation.
But, food isn’t the only place where prices are rising…
As soaring demand has run into limited supply these past couple of years (from COVID and other supply chain disruptions), prices for most major commodities have gone through the roof.
Especially in the metals and mining sector…
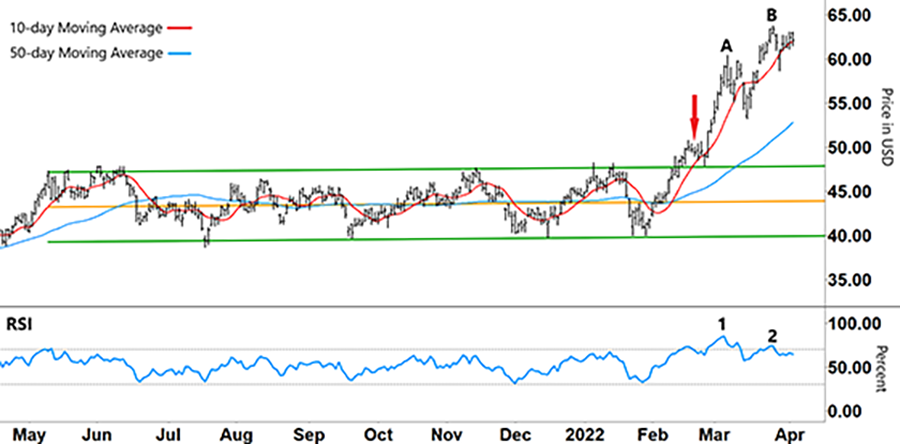
When we last checked in on the SPDR S&P Metals and Mining ETF (XME), it had just broken through a key level (red arrow on the chart below).
After trading in a tight sideways band since May 2021 (and rallying prior to that), it had then recently broken above resistance (upper green line).
Roughly 95% of data on the chart takes place in between the upper and lower green lines, with the orange line representing the median.
As I’ve noted before, breaking key levels – whether support or resistance – is often the precursor to a big move. Especially when those levels have held for as long as XME’s had.
Take another look at the chart…
Daily Chart of the SPDR S&P Metals and Mining ETF (XME)
Source: eSignal
After initially breaking resistance, XME drifted back to test that level to see if it would hold…
After testing and holding support, XME then broke strongly higher. From there, in less than two weeks, XME rallied around 26% (peaking at ‘A’).
Then, after a brief pullback, XME went on to make a higher high at ‘B.’
If we go back to when XME’s rally started in late January through its recent high at ‘B,’ XME has rallied close to 60%.
You only need to check out our two moving averages (MA) to see how this current rally developed…
After tracking each other closely since May 2021, the 10-day MA (red line) broke above the 50-day MA (blue line) in February and continued to accelerate higher from there.
So now, after such a strong move higher, what can we expect from here?
One thing that has caught my attention has been the action in the Relative Strength Index (RSI) at the bottom of the chart…
Daily Chart of the SPDR S&P Metals and Mining ETF (XME)
Source: eSignal
When XME was stuck in a sideways pattern, it tracked the RSI closely.
For example, when the RSI bounced off its oversold signal (lower grey line) – like in July, September, December, and most recently January – this coincided with XME’s share price bouncing off support (lower green line).
However, with this current breakout move, the RSI is now well into overbought territory (above the upper grey line) …
Now it’s showing clear signs of divergence. While ‘B’ made a higher high than ‘A,’ at the same time the RSI was making a lower high (from ‘1’ to ‘2’).
While it’s still early in this emerging pattern, we know that this kind of divergence often precedes a change in direction.
If the RSI continues to break lower, we can expect the XME share price to follow. The RSI would then need to break into the lower half of its band (below 50%) for any reversal to gain momentum.
After that, the 10-day MA crossing back down over the 50-day MA would prove that this current uptrend is over.
Keep in mind it’s still early…
When you see a big breakout like this and the volatility that comes with it, you need to be ready… Because it will throw up lots of trading opportunities ahead.
Regards,
Larry Benedict
Editor, Trading With Larry Benedict
Are you ready for a breakout in XME?
P.S. Have you made any big gains lately? We’d love to hear about them. And as usual, we’re excited to hear what you think of your new eletter, Trading With Larry Benedict. Let us know at feedback@opportunistictrader.com.
Reading Trading With Larry Benedict will allow you to take a look into the mind of one of the market’s greatest traders. You’ll be able to recognize and take advantage of trends in the market in no time.
