Over the past few years, there’s been a huge focus on tech stocks…
With many other profitable sectors flying completely under investors’ radars.
And that means plenty of missed opportunities… like the ones in financial services.
Although the Nasdaq delivered a healthy 27% return in 2021, the Financial Select Sector SPDR Fund (XLF) generated an even bigger 32% over the same time.
While investors were chasing the next big-growth tech story, XLF simply passed them by.
However, after a stellar 2021, this year has been rough on XLF so far.
Initially, XLF held up far stronger than the rest of the market (including tech stocks) during the first few months of the 2022 selloff…
But now, XLF is under huge pressure since mid-March.
Today, I’m going to see if this big drop presents another potential buying opportunity… or if it’s just another false dawn in an ongoing downtrend.
Let’s check out XLF’s chart…
Financial Select Sector SPDR Fund (XLF)
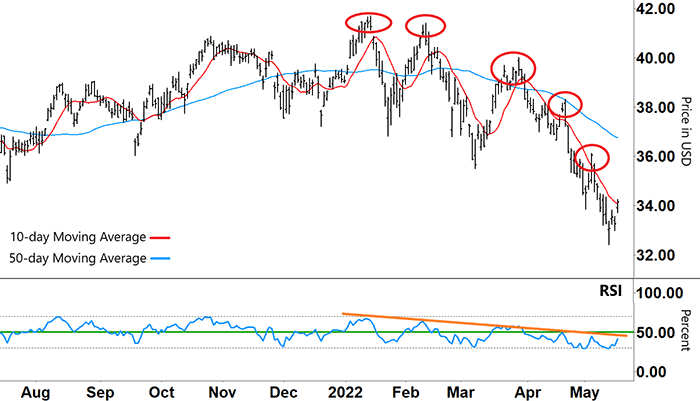
Source: e-Signal
XLF peaked in mid-January… but, after hitting that high, it made a clear series of lower highs (red circles) – a common pattern in a downtrend.
You can find another clear trend in the lower half of the chart…
The Relative Strength Index (RSI) made lower highs (orange line) that coincided with the price chart’s lower highs. This means the RSI’s declining momentum has steadily pulled XLF’s price lower.
Our two moving averages (MA) also added to this bearish sentiment.
After steadily rising throughout the end of 2021, the long-term 50-day MA (blue line) flatlined through January and February 2022 before rolling over in March.
As the downtrend gathered pace, the 50-day MA gradient also steepened lower.
And after zig-zagging multiple times, the 10-day MA finally broke down over the 50-day MA in early April.
Since then, it’s been accelerating further below the 50-day MA – showing the downtrend’s strength.
After this recent fall, XLF is now trading at a 15-month low and around 21% below its early 2022 peak.
This puts XLF firmly in bear territory.
However, over the past few days XLF bounced as the RSI rallied out of oversold territory (below the lower grey dashed line).
Let’s take another look…
Financial Select Sector SPDR Fund (XLF)
Source: e-Signal
So, will this current bounce fade out like all the previous ones? And how should we trade XLF from here?
Well, the RSI provides plenty of clues…
The orange line shows the RSI is in a downtrend. It’s been making lower highs for over four months now.
If the RSI breaks above this resistance (orange line), we could see more buying momentum support XLF’s price.
And if the RSI then breaks into the upper half of its range (green line), XLF could soon trade back around $35-$36.
But, if the RSI forms an inverse ‘V’ at resistance and rebounds lower, that means this current downtrend has further to go. We would need to be ready to sell into the rally.
After such a big fall, the RSI is showing XLF is due for a bounce.
But a quick reversal lower could make this bounce fade out just as quickly, causing further falls ahead.
So, in the coming days we’ll need to watch the RSI like a hawk… and be ready to take action on either outcome.
Regards,
Larry Benedict
Editor, Trading With Larry Benedict
Reading Trading With Larry Benedict will allow you to take a look into the mind of one of the market’s greatest traders. You’ll be able to recognize and take advantage of trends in the market in no time.
