|
Larry’s note: Welcome to Trading with Larry Benedict, the brand new free daily eletter, designed and written to help you make sense of today’s markets. I’m glad you can join us. My name is Larry Benedict. I’ve been trading the markets for over 30 years. I got my start in 1984, working in the Chicago Board Options Exchange. From there, I moved on to manage my own $800 million hedge fund, where I had 20 profitable years in a row. And, I’ve been featured in the book Market Wizards, alongside investors like Paul Tudor Jones. But these days, rather than just trading for billionaires, I spend a large part of my time helping regular investors make money from the markets. My goal with these essays is to give you insight on the most interesting areas of the market for traders right now. Let’s get right into it… |
Low interest rates and soaring demand have seen property prices go through the roof…
With data on Tuesday showing house prices had increased 17.7% year-over-year, there will be plenty of homeowners feeling gratified as they head into the end of the year.
However, it’s not just residential property that has enjoyed the boom. A surge in consumer spending has seen supply chains bursting at the seams.
Demand for industrial property from fulfilment centers to data storage warehousing has seen strong rises in property values across the board.
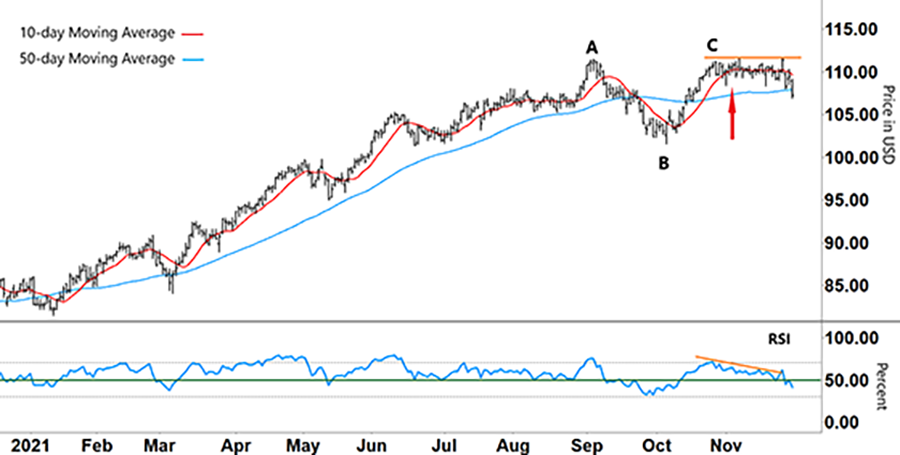
You can see just how strong that growth has been in the chart of the iShares U.S. Real Estate ETF (IYR) below… an exchange-traded fund (ETF) that invests in a diverse range of property classes.
From the start of 2021, IYR has rallied around 30% – almost double the rise in the recent housing data…
iShares U.S. Real Estate ETF (IYR)
Source: eSignal
When we last checked in on IYR around a month ago (red arrow), its long-term uptrend had run out of steam…
Having pulled back from its September 3 high (A) to its low at (B), IYR had subsequently rallied but could not break above ‘A’. For the uptrend to have remained in place, IYR needed to break through ‘A’ and keep moving higher. Instead, it began to plateau at ‘C’.
As the chart shows, for much of the last month IYR has been treading water and trading in a very tight band…
It’s so tight that our regular moving averages (MAs) – the 10-day short-term (red line) and 50-day long-term (blue line) – look like a railway track. Given the huge time period difference between our two MAs, that’s not something that usually happens for this long.
Another factor that developed this past month is the divergence (orange lines) between IYR’s share price and the Relative Strength Index (RSI).
While IYR’s share price continued to trade sideways, the RSI trended down. Recently, I was looking for how the RSI would react to support (green line) at the 50% level…
Quite simply, if IYR’s share price was able to remain steady despite declining momentum, then a bounce off RSI support would likely have propelled IYR higher, giving us an opportunity to go long.
However, as the chart shows below, after bouncing temporarily off this support on November 22, the RSI has now fallen through the green line…
iShares U.S. Real Estate ETF (IYR)
Source: eSignal
The IYR share price has also traded down through the 50-day MA. Having tracked each other so closely for almost a month, it won’t take many further falls for the 10-day MA to cross down over the 50-day MA…
If that crossover happens, along with the RSI continuing to trend down, that could provide an opportunity to go short. The first test for IYR would then be to hold its October low (B) of $101.56.
That level then becomes crucial…
A break below ‘B’ would indicate an emerging downtrend, and would provide another opportunity to go short.
However, if IYR can hold above ‘B’, then that means IYR is transitioning into a sideways range defined by the price levels at ‘B’ and ‘C’. And that’s something that would provide plenty of opportunity for mean reversion trades in either direction.
Regards,
Larry Benedict
Editor, Trading With Larry Benedict
Reader Mailbag
Do you think real estate prices will increase, or will the current pattern hold?
P.S. We’re excited to hear what you think of your new eletter, Trading With Larry Benedict. Let us know at [email protected].