|
Larry’s note: Welcome to Trading with Larry Benedict, the brand new free daily eletter, designed and written to help you make sense of today’s markets. I’m glad you can join us. My name is Larry Benedict. I’ve been trading the markets for over 30 years. I got my start in 1984, working in the Chicago Board Options Exchange. From there, I moved on to manage my own $800 million hedge fund, where I had 20 profitable years in a row. But these days, rather than just trading for billionaires, I spend a large part of my time helping regular investors make money from the markets. My goal with these essays is to give you insight on the most interesting areas of the market for traders right now. Let’s get right into it… |
It has certainly been a wild ride these past couple of weeks…
Volatility has struck the major indices like the Nasdaq and S&P 500, and even flowed into crypto and property trusts.
Wherever you’ve looked, there has been plenty of red ink.
To keep track of this volatility, I take a look at the VIX (CBOE Volatility Index).
Regular readers will know that I write about the VIX often. We also know that when volatility increases, we can expect to see stock prices (and the indices) fall.
Yesterday, we saw how this higher volatility is flowing through the S&P 500.
Today, I want to turn our attention to its effect on the Nasdaq 100.
One way I keep an eye on the Nasdaq 100 is through the Invesco QQQ Trust (QQQ). When I last wrote about it, QQQ had only recently rolled over.
Let’s check out the chart to see what has happened since then…
QQQ Chart
Source: eSignal
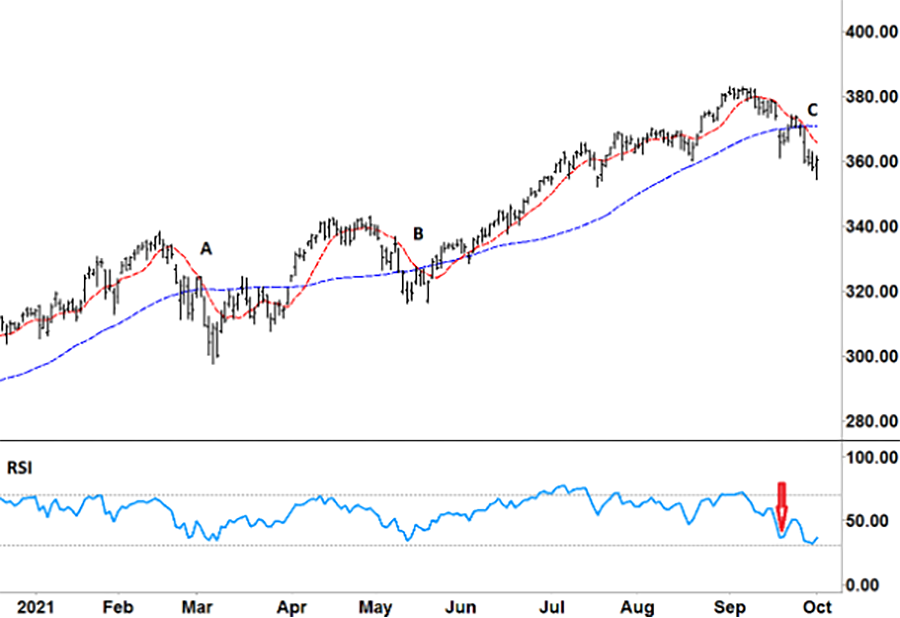
On the price chart are two moving averages (MA). The red dashed line represents the short-term 10-day MA, and the blue dashed line represents the long-term 50-day MA.
From the start of the year, the 50-day MA has been trending up.
During that time, the shorter-term 10-day MA crossed down over the 50-day MA in early March (A), mid-May (B), and right at the end of September (C).
As the chart shows, each of these falls corresponded with a full-range fall in the RSI – a move from the upper grey dotted line (overbought) down to the lower grey dotted line (oversold).
Now, with the current move down, the RSI is again right on the cusp of the lower grey line.
The interesting thing for me, though, are the different patterns the RSI formed as it closed in on the lower grey line…
And, just as importantly, trying to figure out how these might apply to the current fall.
So, let’s take another look at the RSI for QQQ…
QQQ Chart
Back in March (A), the RSI seesawed several times before moving back higher. While in May (B), the RSI only formed a single ‘V’ before rallying.
When I wrote about the recent fall with QQQ on September 22 (red arrow), RSI was right in the middle of forming another ‘V’. However, this turned out to be a false floor.
Although QQQ went on to rally, that was only temporary. Momentum waned over this past week – sending QQQ to a lower low.
While the RSI is now again showing an uptick in momentum, it’s still too early to know if this new floor will hold.
That’s why the price action this week will be so important…
If the RSI forms a ‘V’, the first test is for QQQ to rally back above the 10-day MA (red dashed line).
And, if that happens, the next (bigger) test will be to see if the 10-day MA crosses back above the 50-day MA (blue dashed line).
If both were to happen, that could provide an opportunity to go long.
However, should the RSI fail to bounce (and instead continue to move down and/or sideways), that could mean further weakness for QQQ ahead.
In other words, the current move down could just be the start of a bigger fall…
The good thing is that either scenario should provide plenty of trading opportunities. That’s why I’ll be watching QQQ as closely as ever this week.
Regards,
Larry Benedict
Editor, Trading With Larry Benedict
I’d like to thank the readers who’ve written in about my e-letter, here are some of the latest responses I’ve received…
Dear Larry,
I’m really enjoying and appreciating your email trading lessons. It’s the next best thing to being in your service (which I would love) and watching your trade calls, real time, and hearing your reasons for the picks.
I’m getting close to 75 and have been both investing and trading stocks for many years, and options since 2010… and by the way, I love the options best! But I’ve also been through some physical problems resulting from spinal injuries, so after years of dealing with all that, I’m not as sharp as I was back in the late 1990’s, when I first learned technical analysis and started trading.
So, your e-letter has been a wonderful help for me to review things I’ve forgotten, or to simply be mindful of things I stopped watching along the way. And as another reader posted – the length of your letter is perfect. It’s not too long or too short. It’s just right and accomplishes its purpose splendidly!
Thanks so much for doing this! I’m forever grateful.
– Lynn
I just began reading Larry’s site and found great reinforcement and added information on charting! I will definitely continue reading Larry’s explanations and recommendations. Thank you.
– Sally
Hello Larry Benedict, I really appreciate your insight on different companies and their moves.
– Barbara
P.S. We’re excited to hear what you think of your new eletter, Trading With Larry Benedict. Let us know at feedback@opportunistictrader.com.
Reading Trading With Larry Benedict will allow you to take a look into the mind of one of the market’s greatest traders. You’ll be able to recognize and take advantage of trends in the market in no time.
