|
Larry’s note: Welcome to Trading with Larry Benedict, the brand new free daily eletter, designed and written to help you make sense of today’s markets. I’m glad you can join us. My name is Larry Benedict. I’ve been trading the markets for over 30 years. I got my start in 1984, working in the Chicago Board Options Exchange. From there, I moved on to manage my own $800 million hedge fund, where I had 20 profitable years in a row. But these days, rather than just trading for billionaires, I spend a large part of my time helping regular investors make money from the markets. My goal with these essays is to give you insight on the most interesting areas of the market for traders right now. Let’s get right into it… |
With all the attention given to the mega-cap tech stocks, it’s no wonder that some investors see them as the only game in town.
After all, some of these companies – like Amazon or Apple – have generated outsized returns for decades.
However, focusing on just one sector of the market can cause you to miss other opportunities. Some of which might be currently leaving tech stocks in their wake…
One of those opportunities is the financial services sector.
Over the past 12 months, this sector has risen nearly 60% – more than double the tech sector’s 27.5%.
One way I keep track of this sector is through the Financial Select Sector SPDR Fund (XLF). Right now, the chart is showing that XLF is pressing up against a key resistance level.
But first, let’s backtrack a little bit…
When the rest of the market rallied hard last year, XLF was left behind.
In fact, XLF struggled to break out of its range for much of this year too.
Even in late November 2020, XLF was still trading 20% lower than its pre-COVID high ($31.38). It only broke through that high this January.
After playing catch-up from last November to this May, XLF’s chart pattern changed…
Financial Select Sector SPDR Fund (XLF)
Source: eSignal
After a steep rally in the beginning of the year, XLF transitioned from a strong uptrend to a range-bound market… But now, the red trendline shows XLF is creeping up gradually.
The two dark blue lines on the chart represent where 95% of the price action has taken place. And apart from two days in July, XLF has stayed above the lower blue line.
It’s a similar story on the upper side of the channel. XLF pushed right up against this level in the first week of June, then fell. It then tried to break up through it twice in August, but also failed.
As you can see, however, this upper level has come into play again. So, XLF is now trying to break higher out of its range.
Regular readers will know that if a stock breaks through a resistance line, that can change into a new support level (and vice versa).
And that’s what I’ll be looking for in XLF over the next week… If XLF can break above this upper band (dark blue line) and hold, it could go on to rally further from there.
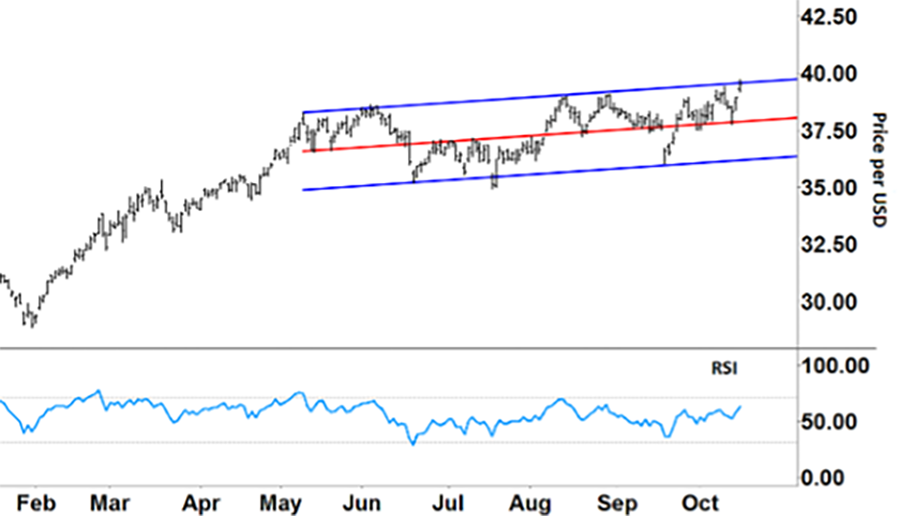
Let’s take another look at the chart, this time focusing on the Relative Strength Index (RSI) at the bottom…
Financial Select Sector SPDR Fund (XLF)
XLF pierced its upper band late last week – along with the RSI trending up – showing increasing momentum.
If XLF continues to rally, the next test will be how its share price reacts to any potential overbought signal from the RSI (over 70).
The other thing driving XLF’s share price right now is company earnings…
XLF’s two biggest components are Berkshire Hathaway (BRK.A) at 12.14%, and JPMorgan Chase & Co (JPM) at 11.74%.
So far, the market has reacted reasonably positive to the latter’s Q3 earnings posted late last week…
Berkshire Hathaway is due to release its results in a couple of weeks (though no firm date has yet been set). A strong result here could really help propel XLF higher.
In the meantime, however, our immediate focus remains on how XLF trades around the upper band of the trading channel…
If XLF fails to break higher (and hold this level), then all eyes will be on the RSI.
An overbought signal from the RSI – along with XLF dropping lower after hitting resistance – could soon see XLF reverting to the mean. And that could provide an opportunity to go short.
Either way, the price action around the upper trading band – along with upcoming profit results – will set XLF’s chart pattern for the coming month.
Even after rising 60% over the last year, there could still be plenty of trading opportunities in XLF ahead.
Regards,
Larry Benedict
Editor, Trading With Larry Benedict
P.S. We’re excited to hear what you think of your new eletter, Trading With Larry Benedict. Let us know at feedback@opportunistictrader.com.
Reading Trading With Larry Benedict will allow you to take a look into the mind of one of the market’s greatest traders. You’ll be able to recognize and take advantage of trends in the market in no time.
