|
Larry’s note: Welcome to Trading with Larry Benedict, the brand new free daily eletter, designed and written to help you make sense of today’s markets. I’m glad you can join us. My name is Larry Benedict. I’ve been trading the markets for over 30 years. I got my start in 1984, working in the Chicago Board Options Exchange. From there, I moved on to manage my own $800 million hedge fund, where I had 20 profitable years in a row. But these days, rather than just trading for billionaires, I spend a large part of my time helping regular investors make money from the markets. My goal with these essays is to give you insight on the most interesting areas of the market for traders right now. Let’s get right into it… |
One of the things I’ve been writing about a lot over these past months is the importance of the Nasdaq.
That’s because the largest stocks on the Nasdaq have been the major driving force behind the performance of the broader market, the S&P 500.
While both tech and value stocks initially helped propel the S&P 500 out of its March 2020 lows, the Nasdaq has been doing all the heavy lifting since May this year. Since then, value stocks have been trading sideways in a tight range.
One way I keep an eye on the Nasdaq 100 is through the Invesco QQQ Trust ETF (QQQ).
When we last looked at QQQ earlier this month, it was quickly approaching a key level. Today, I want to run through what has happened since then… because things are about to get interesting.
Let’s pull up the chart…
Invesco QQQ Trust ETF (QQQ)
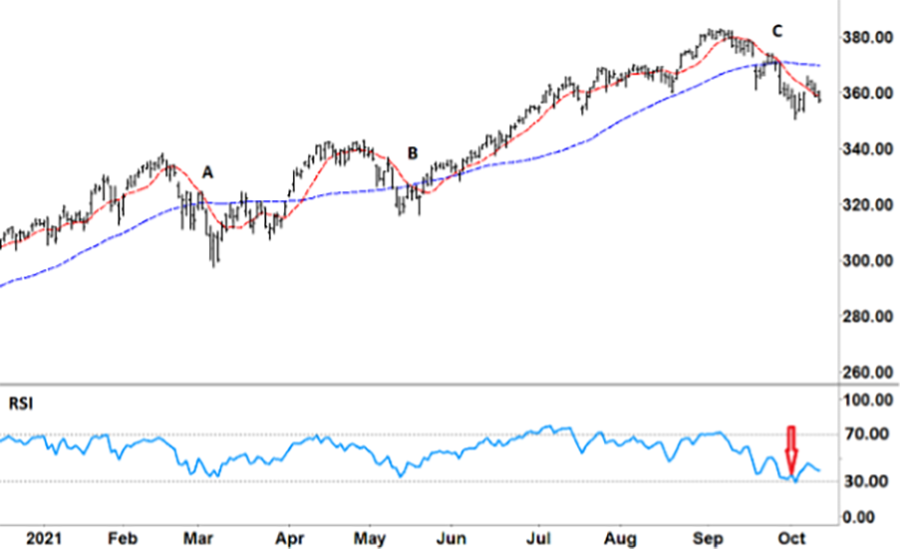
Source: eSignal
Let’s start with our two moving averages (MA). The red dashed line is our 10-day MA (short-term trend), and the blue dashed line is the 50-day MA (long-term trend).
When we last looked at QQQ, (red arrow) I was looking for something very specific…
I wanted to see if the crossover at ‘C’ (the 10-day MA crossing down over the 50-day MA) might repeat what happened at ‘A’ and ‘B’.
In both occasions (‘A’ and ‘B’), the Relative Strength Index (RSI) formed a ‘V’ (or turned sharply higher), and the 10-day MA went on to cross back above the 50-day MA. From there, QQQ went on to rally before making a higher high.
At the time of writing, the RSI was turning up and looked to be in the early stages of forming a ‘V’. From the perspective of the RSI alone, this action was very similar to what happened after ‘A’ and ‘B’.
However, the corresponding price action at ‘C’ has been quite different.
Let’s take another look at the chart…
Invesco QQQ Trust ETF (QQQ)
If you go back to ‘A’, you’ll notice that after QQQ’s share price bottomed out, it soon rallied back above the 50-day MA. While it see-sawed back and forth briefly, it went on to make a new high.
And at ‘B’, a similar thing happened – but in a much shorter time frame. Soon after bottoming out, QQQ went on to cross back above the 50-day MA. From there, it rallied to a higher high.
But as you can see, the price action after ‘C’ is quite different…
After the share price bottomed out at ‘C’, QQQ did rally (it gapped slightly higher), but only above the 10-day MA (red dashed line) – not the 50-day MA. What’s more, the recent price action has been weak.
Rather than continuing with its rally, it soon ran out of momentum. That also coincided with the RSI turning down.
Unless the share price can stay above the 10-day MA – and then cross back above the 50-day MA – this current pullback could fall even further…
The next real test is to see what happens with the RSI. As you can see, it’s still close to the lower grey horizontal line. If the RSI closes in on this line without a subsequent rally, that will increase the odds of QQQ’s pullback gaining momentum.
And that could provide an opportunity to go short.
Don’t forget, this action also has major implications for the S&P 500. With value stock trading sideways, and the Nasdaq trending down, there could soon be opportunities to short the S&P 500 as well.
Regards,
Larry Benedict
Editor, Trading With Larry Benedict
I’d like to thank the readers who’ve written in about my eletter, here are some of the latest responses I’ve received…
Your letter is good, helpful, and succinct.
– Elwood
Wonderful to read each day. You most definitely are making great things happen for us. Love the eletter. Thanks a million, Larry.
– Donna
As an individual investor, it’s good to have different experienced eyes watching a vast market experience. Thanks for sharing.
– Fletcher
Hi, thanks for your wonderful newsletter. I’m learning a lot as I previously reported to you. Today, I just wanted to say, “Thank you!” for one aspect of your articles.
As you’re discussing a given chart, you repeat the same chart as one moves down through the article. This makes it possible to read your commentary without having to constantly scroll back up to the first occurrence of the chart to see what the commentary is describing.
This is a small point, to be sure, but it makes reading/studying your newsletter much easier than some others that only include a given chart once. Thanks again.
– Gregory
P.S. We’re excited to hear what you think of your new eletter, Trading With Larry Benedict. Let us know at feedback@opportunistictrader.com.
Reading Trading With Larry Benedict will allow you to take a look into the mind of one of the market’s greatest traders. You’ll be able to recognize and take advantage of trends in the market in no time.
