|
Larry’s note: Welcome to Trading with Larry Benedict, the brand new free daily eletter, designed and written to help you make sense of today’s markets. I’m glad you can join us. My name is Larry Benedict. I’ve been trading the markets for over 30 years. I got my start in 1984, working in the Chicago Board Options Exchange. From there, I moved on to manage my own $800 million hedge fund, where I had 20 profitable years in a row. But these days, rather than just trading for billionaires, I spend a large part of my time helping regular investors make money from the markets. My goal with these essays is to give you insight on the most interesting areas of the market for traders right now. Let’s get right into it… |
Yesterday, we looked at home construction – a strong gauge as to how the wider economy is performing. That’s because when home construction is booming, so is the economy.
Today, I want to continue with the real estate theme. But, I want to focus purely on real estate as an asset class.
There are all types of real estate ETFs on the market. Some specialize in just one type of real estate, like industrial property, for example.
However, there’s one ETF that gives me an overview for the broader real estate sector’s performance – the iShares U.S. Real Estate ETF (IYR).
IYR invests in a range of real estate investment trusts (REIT) like office, retail, residential, and industrial.
However, it also invests in specialized REITs. These include communication towers, data centers, and public storage facilities.
This diversity lets me see the true picture of the wider sector. And that’s why IYR’s recent price action looks very interesting.
Let’s look at this chart of IYR…
iShares U.S. Real Estate ETF (IYR) Price Chart
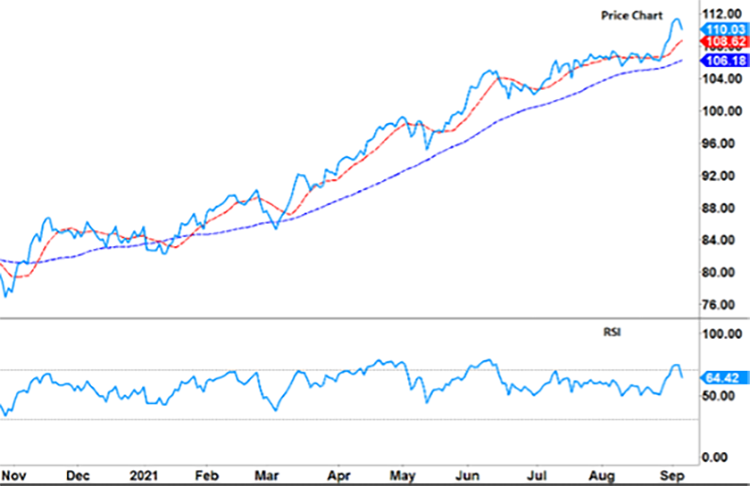
Source: eSignal
From the November 2020 low ($76.33) to its recent high ($111.44), IYR rallied about 46%.
The chart shows two moving averages (MA). The red dotted line represents a 10-day MA (short-term trend). The dark-blue dotted line is a 50-day MA (long-term trend).
Apart from a brief crossover in January 2021, the 10-day MA has stayed above the 50-day MA consistently. In other words, the uptrend has remained intact.
Below the price chart is the Relative Strength Index (RSI). When the RSI has indicated IYR as overbought (above the black dotted line), the share price subsequently fell.
This happened from April into May. Then again in June. Each time the RSI peaked in both scenarios, IYR fell by around 5%.
The jump this week has once again put IYR into overbought territory.
So, what can we expect?
Should history repeat, IYR could be in for a short, swift pullback. A 5% fall – like the previous two – is enough to generate a nice, profitable trade.
However, the bigger potential lies with the longer-term trend.
After the RSI peaked in April, May, and June, the 10-day MA fell. However, it did not cross below the 50-day MA.
In both cases, IYR went on to make a higher high.
Even if IYR should fall in the short term, I’ll be watching these two moving averages…
If the 10-day MA stays above the 50-day MA, then that means the uptrend remains intact.
A V-shaped trough in the RSI could then be a potential trigger to go long. For example, a V-shaped trough in the RSI in November, March, and May preceded a rally.
However, should the 10-day MA cross down through the 50-day MA, then that brings a potential short trade into play.
I’ll also be looking at the 50-day MA (long-term trend) rolling over and heading down.
If both of these were to occur, that could put the odds of a successful short trade more firmly in our favor.
With the spike this week in IYR, it has become a true test between those investors who think the real estate market has more room to run… and those who think it has run too far.
We’ll likely soon find out who is right…
Regards,
Larry Benedict
Editor, Trading With Larry Benedict
P.S. Last night, I hosted my special presentation about an upcoming phenomenon that’s quickly approaching the market, and I would like to thank everyone who attended.
During the event, I went over the best way to use this short window in the market for big profits… I even gave away a free ticker to show you how to get started…
If you missed it the first time, you could still watch it, but not for much longer. So, make sure you watch the replay right here.
Reading Trading With Larry Benedict will allow you to take a look into the mind of one of the market’s greatest traders. You’ll be able to recognize and take advantage of trends in the market in no time.
